Back

Artworks Discovery: An art exploration and search system

OVERVIEW

Overview

Artworks Discovery is the first unified entry point for art content the company built. It lets users explore works from galleries, Artnet Auctions, partner auction houses, and historical sale records within a single interface, across a database of more than 50 million items.

On the surface this is a horizontal integration of content. Underneath, it held three thornier challenges: data structured differently across heterogeneous sources (data schema inconsistency), market semantics that conflict with one another (market semantics mismatch), and a difference in how different kinds of users search (search intent variance).

Some users arrive with a specific goal, looking for a particular work. Others start from an artist, a style, or a market type. So the scope grew from a single page into an exploration system that has to support several search intents at once while keeping information consistent.

The project spans two core surfaces: the Discovery list page (browse and filter across sources) and the Artwork detail page (a single work's information, brought together).

Role
Product Designer.
Responsibilities
Information architecture, interaction design, usability research.
Timeline
About six months, including launch and iterations.
Team
Two designers, the internal product team, and an external development partner.

THE PROBLEM

Art content was scattered across four sources, and they weren't consistent

Problem statement

When browsing artworks, I want to find everything I need in one search system, so I don't have to jump between different sites to gather it.

Art content was scattered across four sources: galleries, Artnet Auctions, partner auction houses, and historical sale records. Each had a different data structure and market meaning, and they were not consistent with one another.

Under the existing setup, users had to switch between systems and piece the information together themselves to understand a work's full market context.

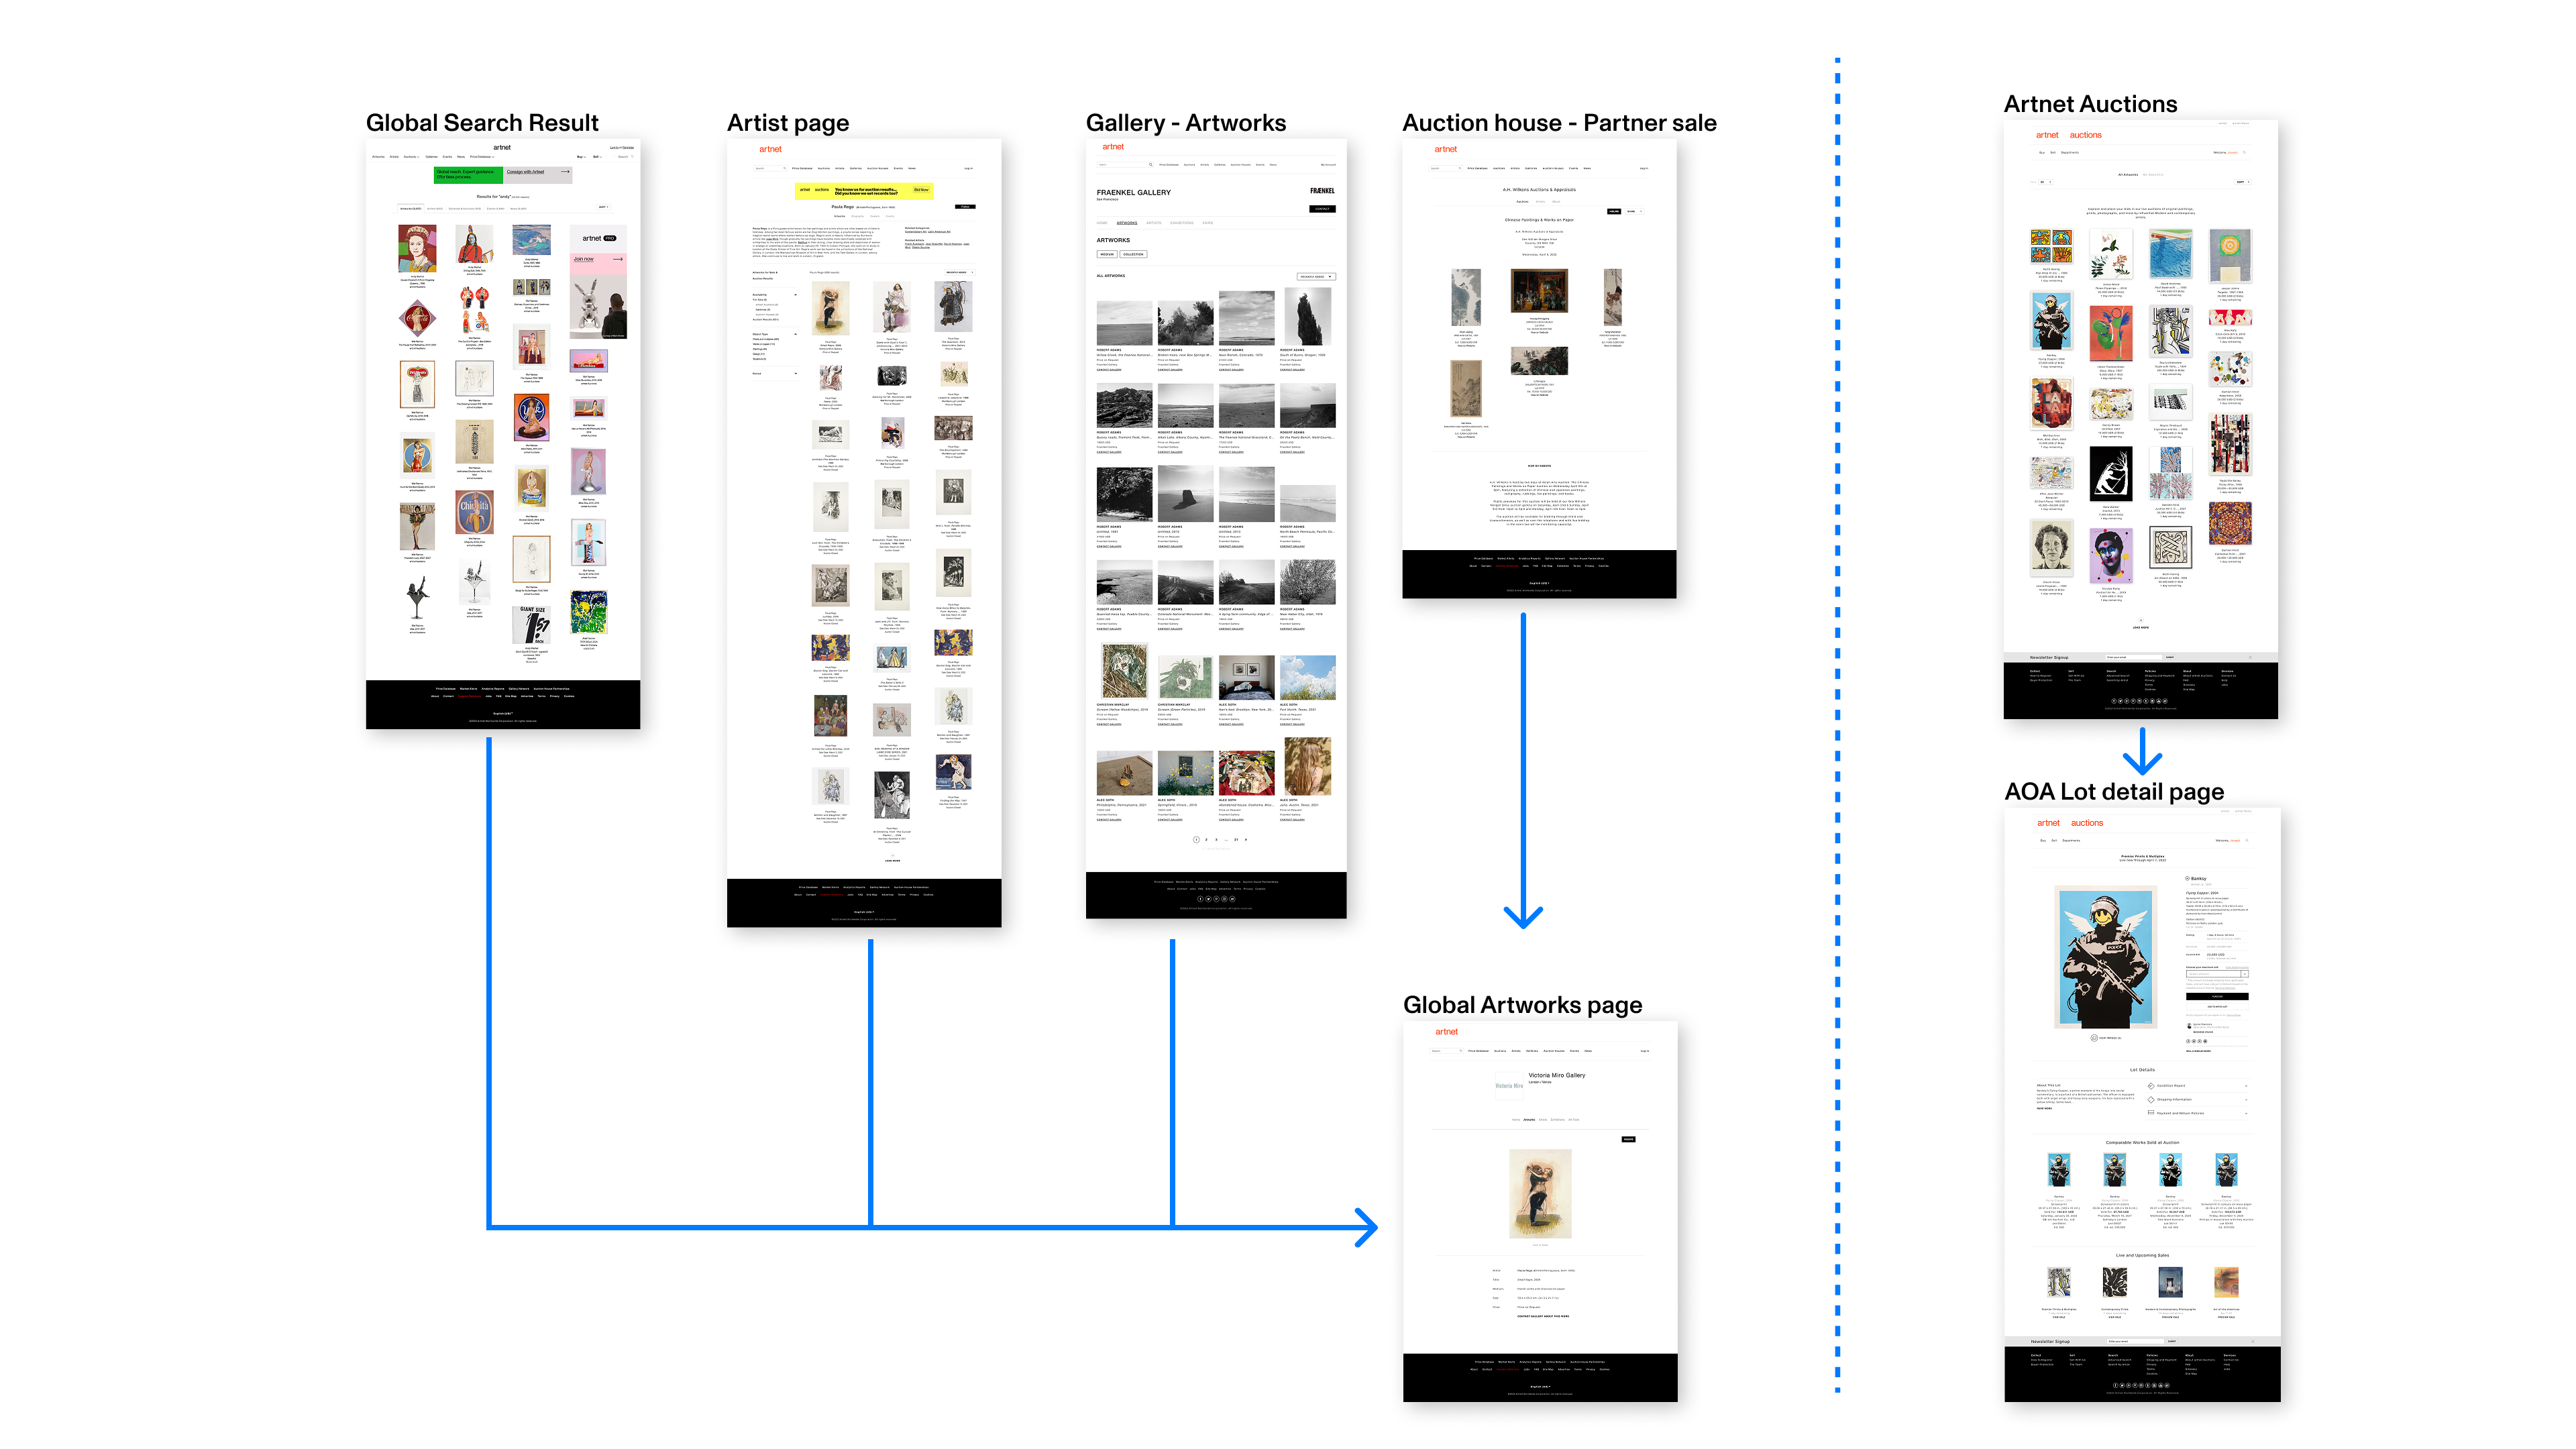
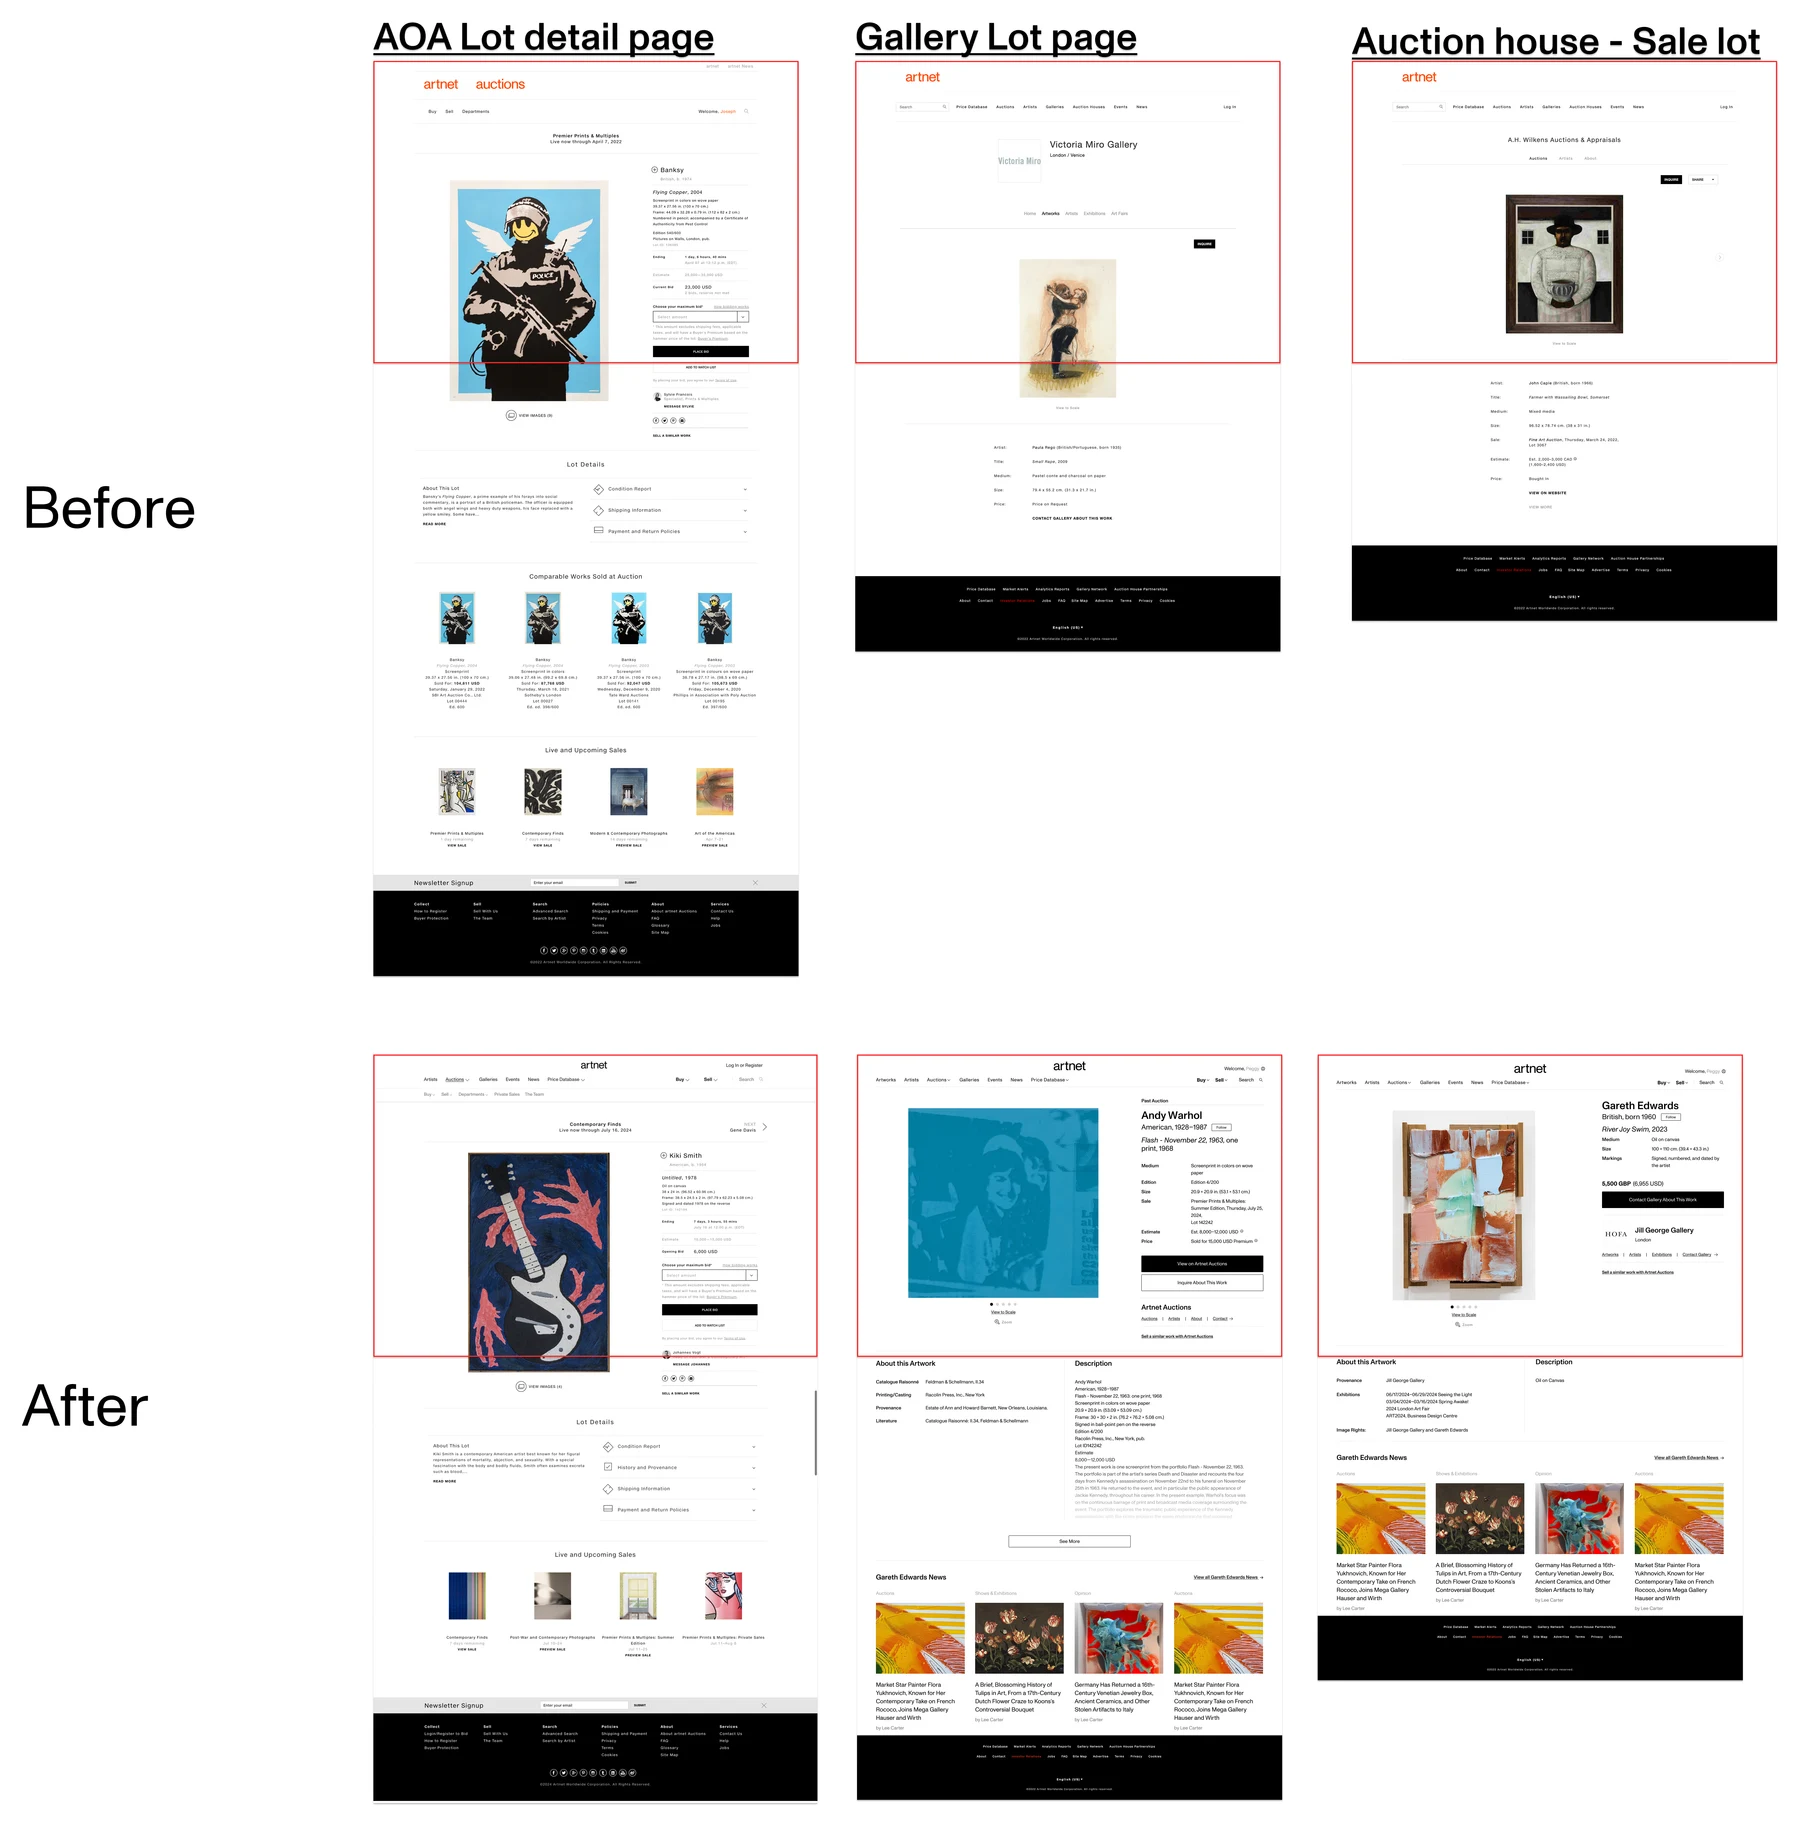
A map of the legacy entry points: a global search result, an artist page, a gallery artworks page, an auction-house partner-sale page, and Artnet Auctions with its lot detail page, each sitting as its own separate page.
The legacy setup: art content lived across separate entry points (global search, artist pages, gallery and auction-house pages, Artnet Auctions), so users hopped between pages to piece a work's market together.

HMW

How might we present artwork data from different sources in one harmonious design language, without creating conflict between them?

And avoid treating the primary market (gallery sales) and the secondary market (auction results) as directly, like-for-like comparable data.

THE SOLUTION

Breaking source silos, while keeping market-semantic boundaries

I redesigned two core surfaces: the Discovery list page handles cross-source integration, browsing, and filtering; the Artwork detail page presents a single work's context. Here they are separately.

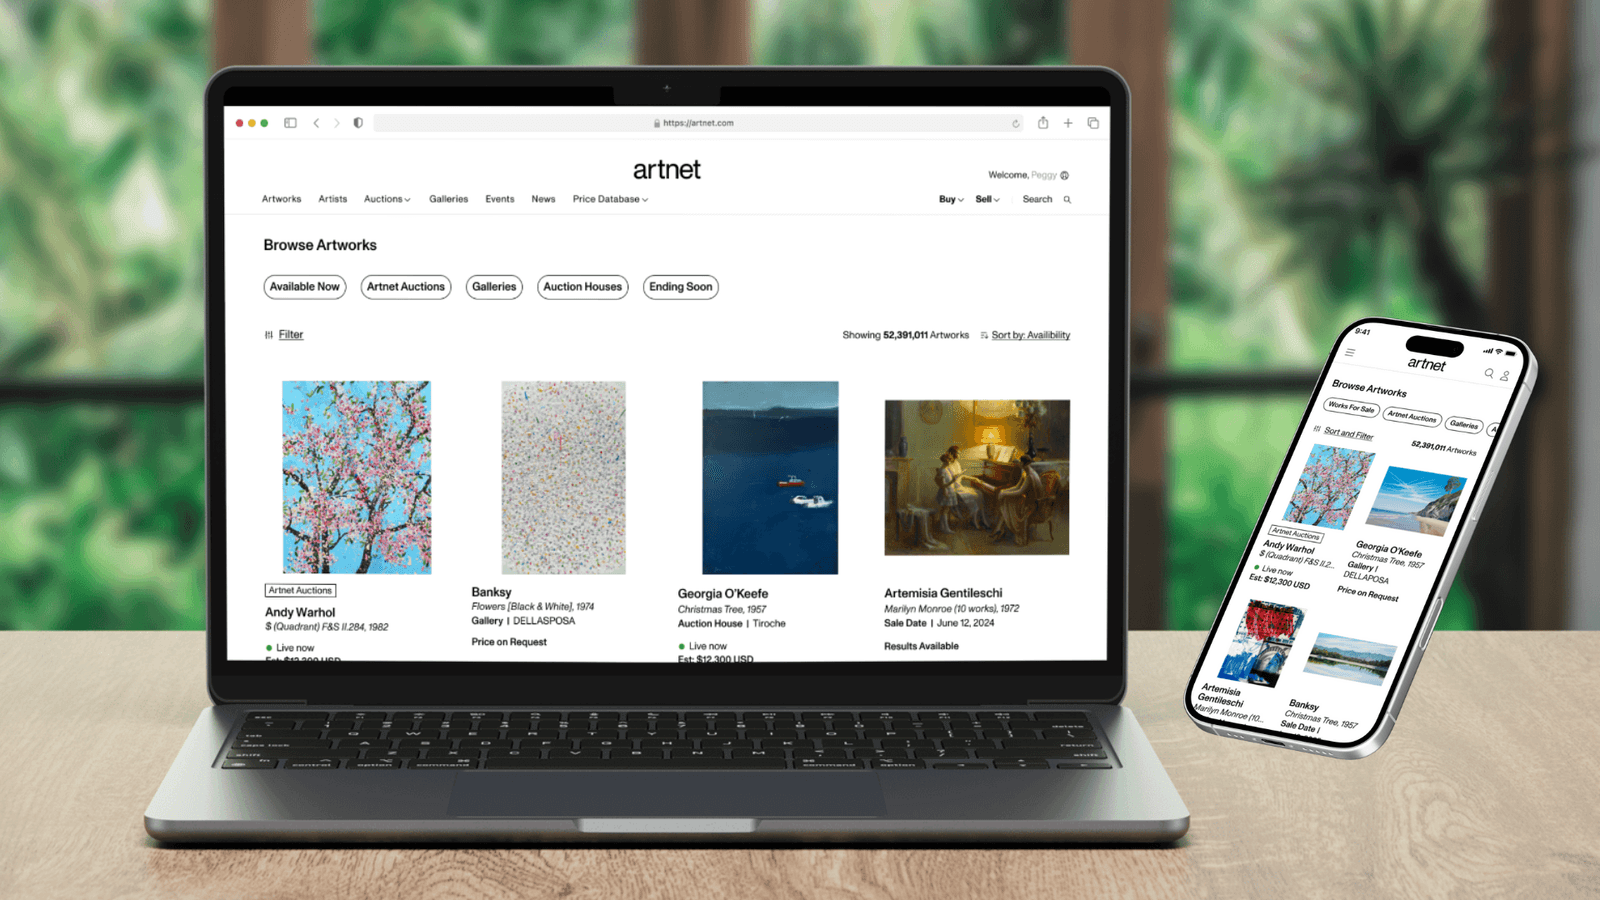
Artworks Discovery running on a laptop and phone: the Browse Artworks page with source filters and a grid of works from galleries, auctions, and records.
Artworks Discovery as a live, responsive interface across desktop and mobile.

Surface 01 — Discovery list page

An aggregated entry point that lets galleries, auctions, and sale history sit together in one smoothly browsable list.

A unified card structure that keeps source differences

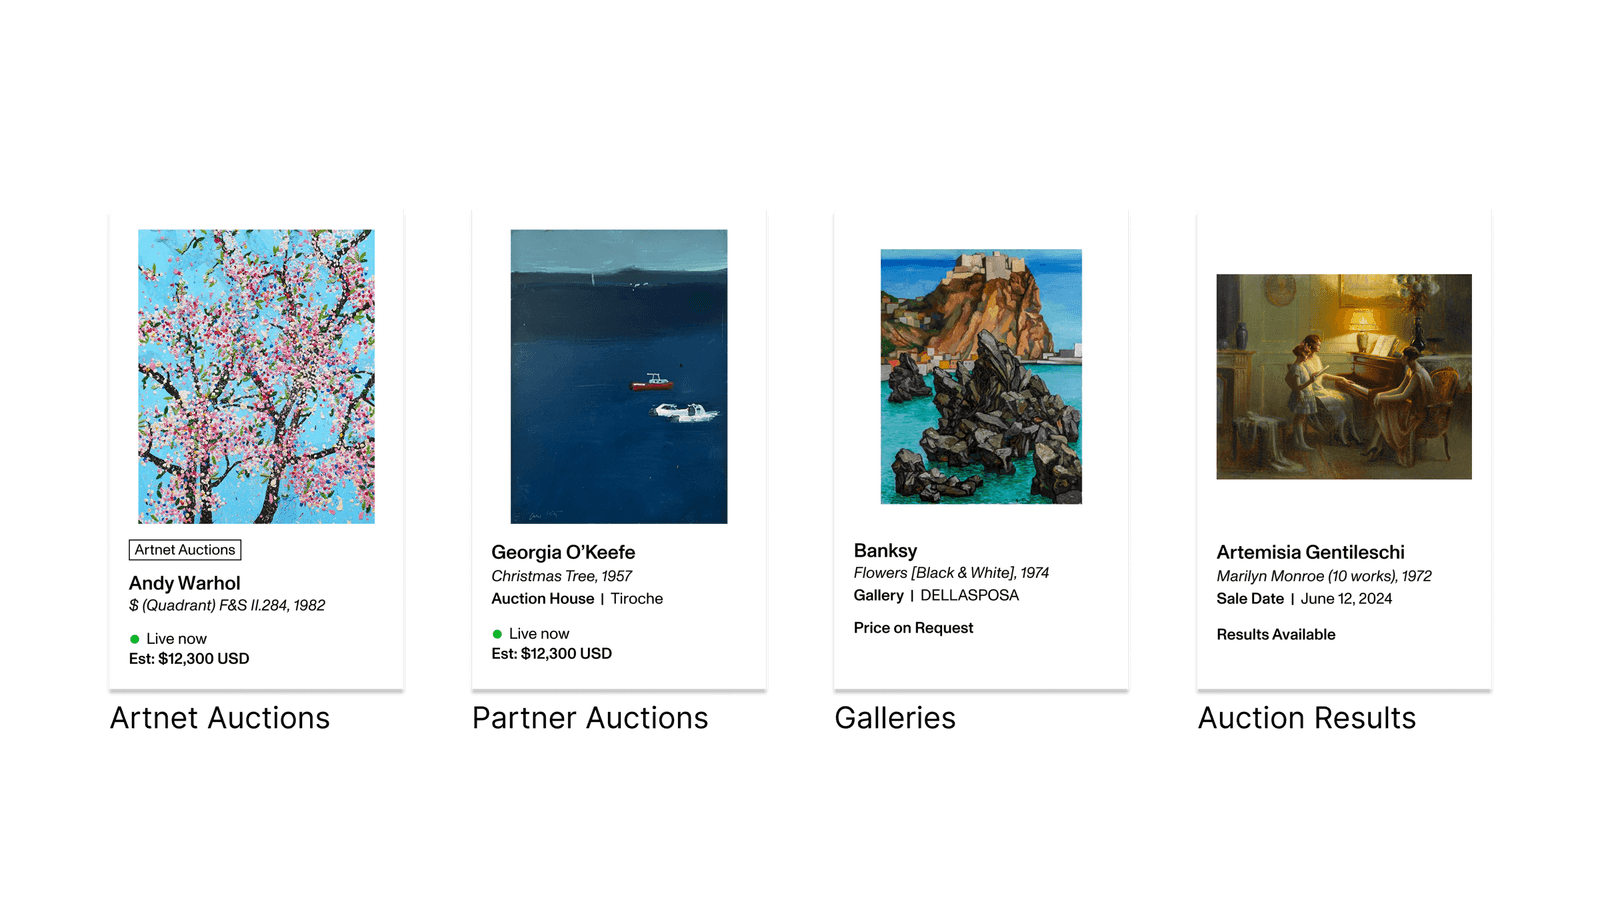
Every work uses the same card design, but keeps its own market meaning: gallery works are marked "Price on Request," live auctions show "Live Now" with an estimate, and closed sales show "Results Available." One layout holds different market states without flattening them.

Four artwork cards sharing one layout: an Artnet Auctions lot marked Live now with an estimate, an external auction-house lot, a gallery work marked Price on Request, and a closed sale marked Results Available.

Source-driven filters, and a layout consistent across devices

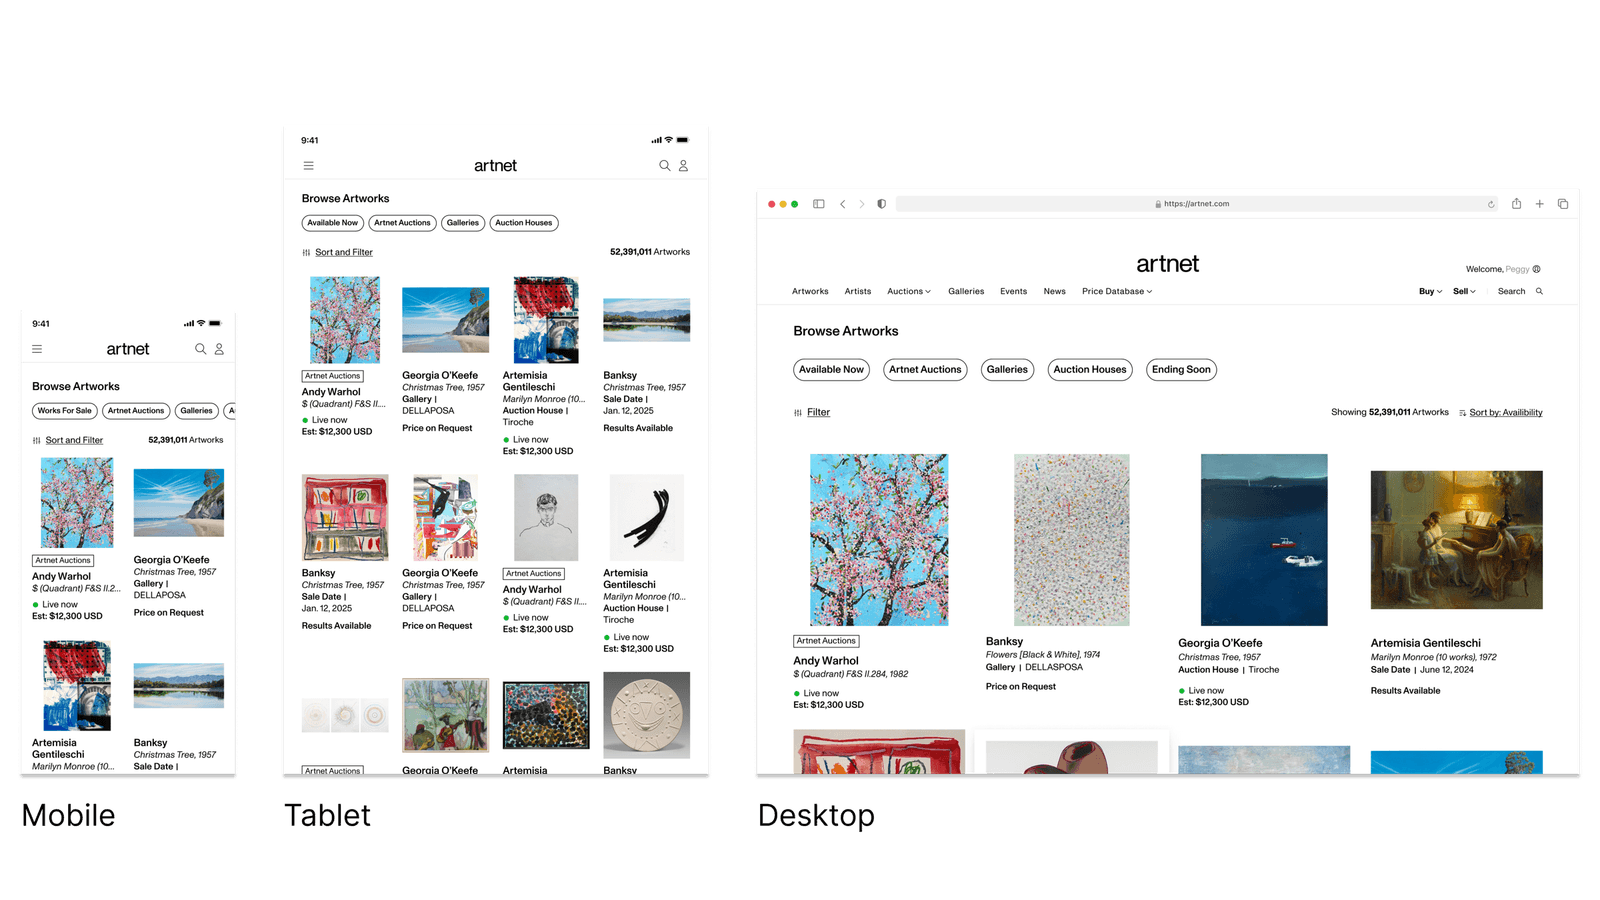
Filters split by data source and state, including Available Now, Artnet Auctions, Galleries, Auction Houses, and Ending Soon, to work through more than 50 million works. The same layout extends from phone to desktop, so a work's reading structure doesn't shift with screen size.

The Browse Artworks page on mobile, tablet, and desktop, with source filters: Available Now, Artnet Auctions, Galleries, Auction Houses, and Ending Soon.
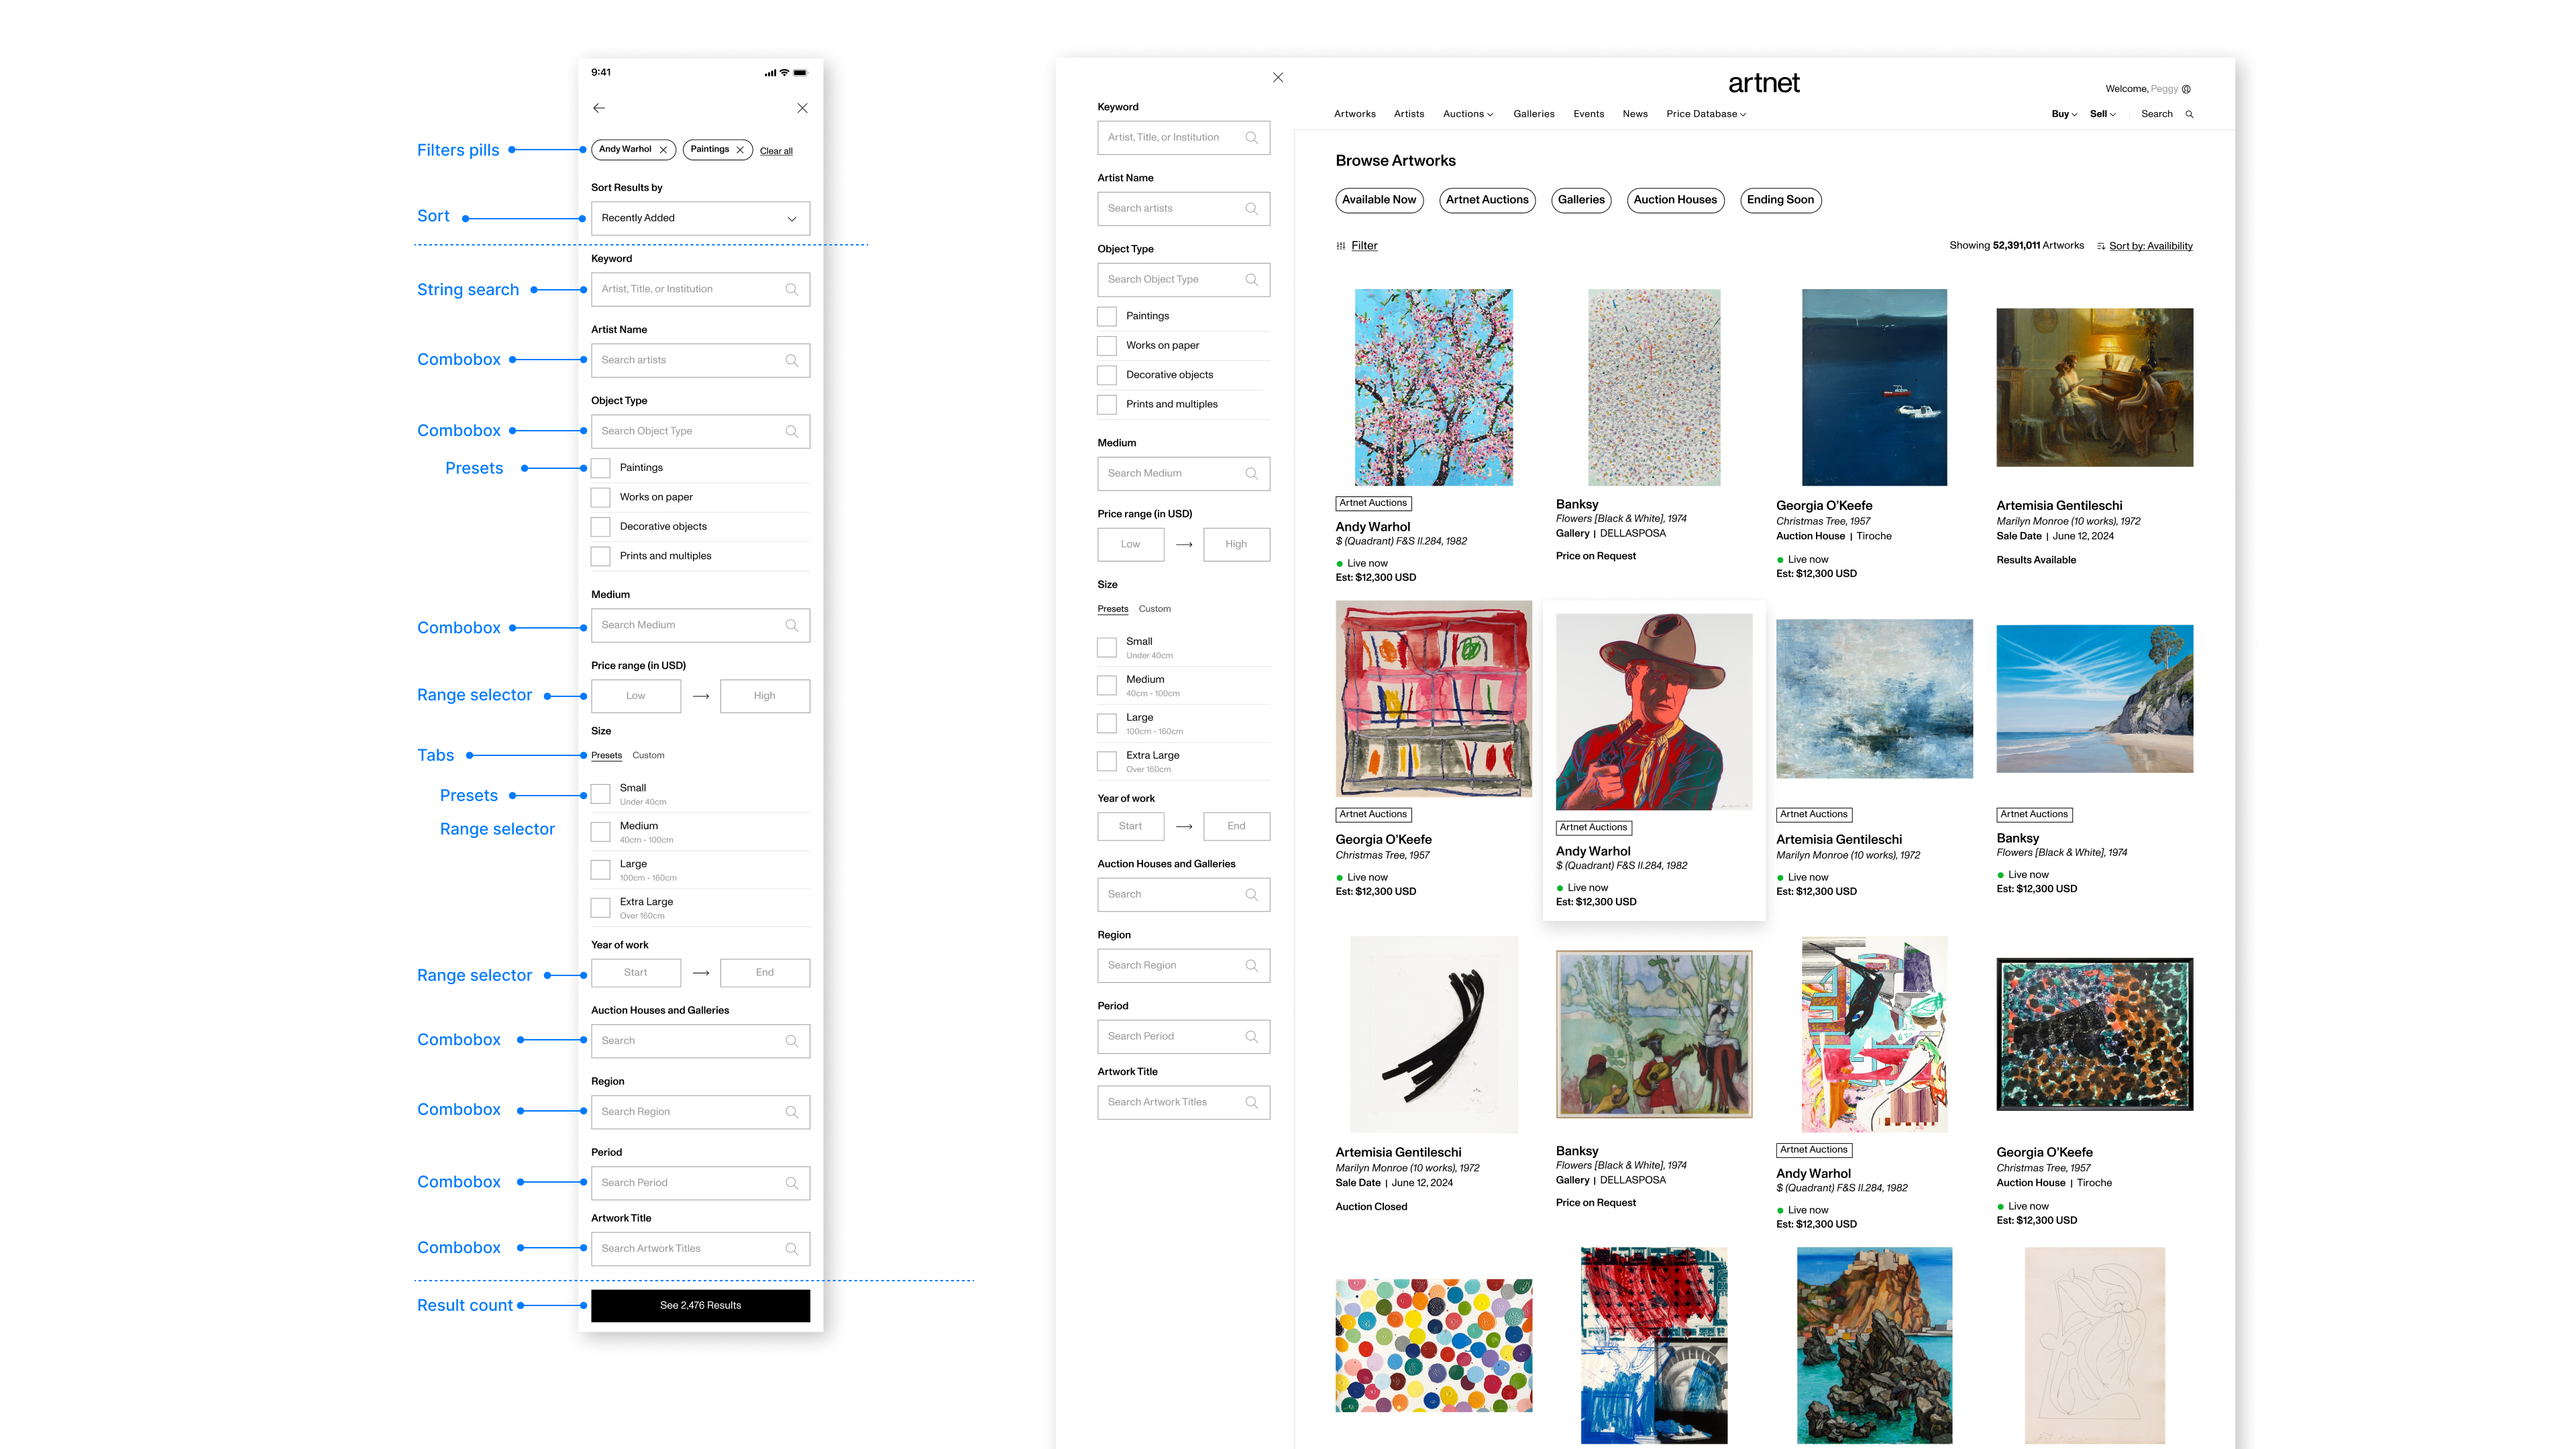
A close-up of the filter panel on mobile and desktop, with all fields labeled: keyword, artist name, object type, medium, price range, size, year of work, auction houses and galleries, region, period, and artwork title, plus filter pills and a result count.
A closer look at the filter: the many search fields that used to be split across separate pages, keyword, artist, medium, price, size, year, region, brought into one source-aware panel with presets and ranges, shown on mobile and desktop.

Surface 02 — Artwork detail page

The detail view for a single work, carrying its market context clearly by source.

Reorganizing the information hierarchy

The redesign gives source information, market data, and recommended works each a block of their own, instead of crowding into the same layer.

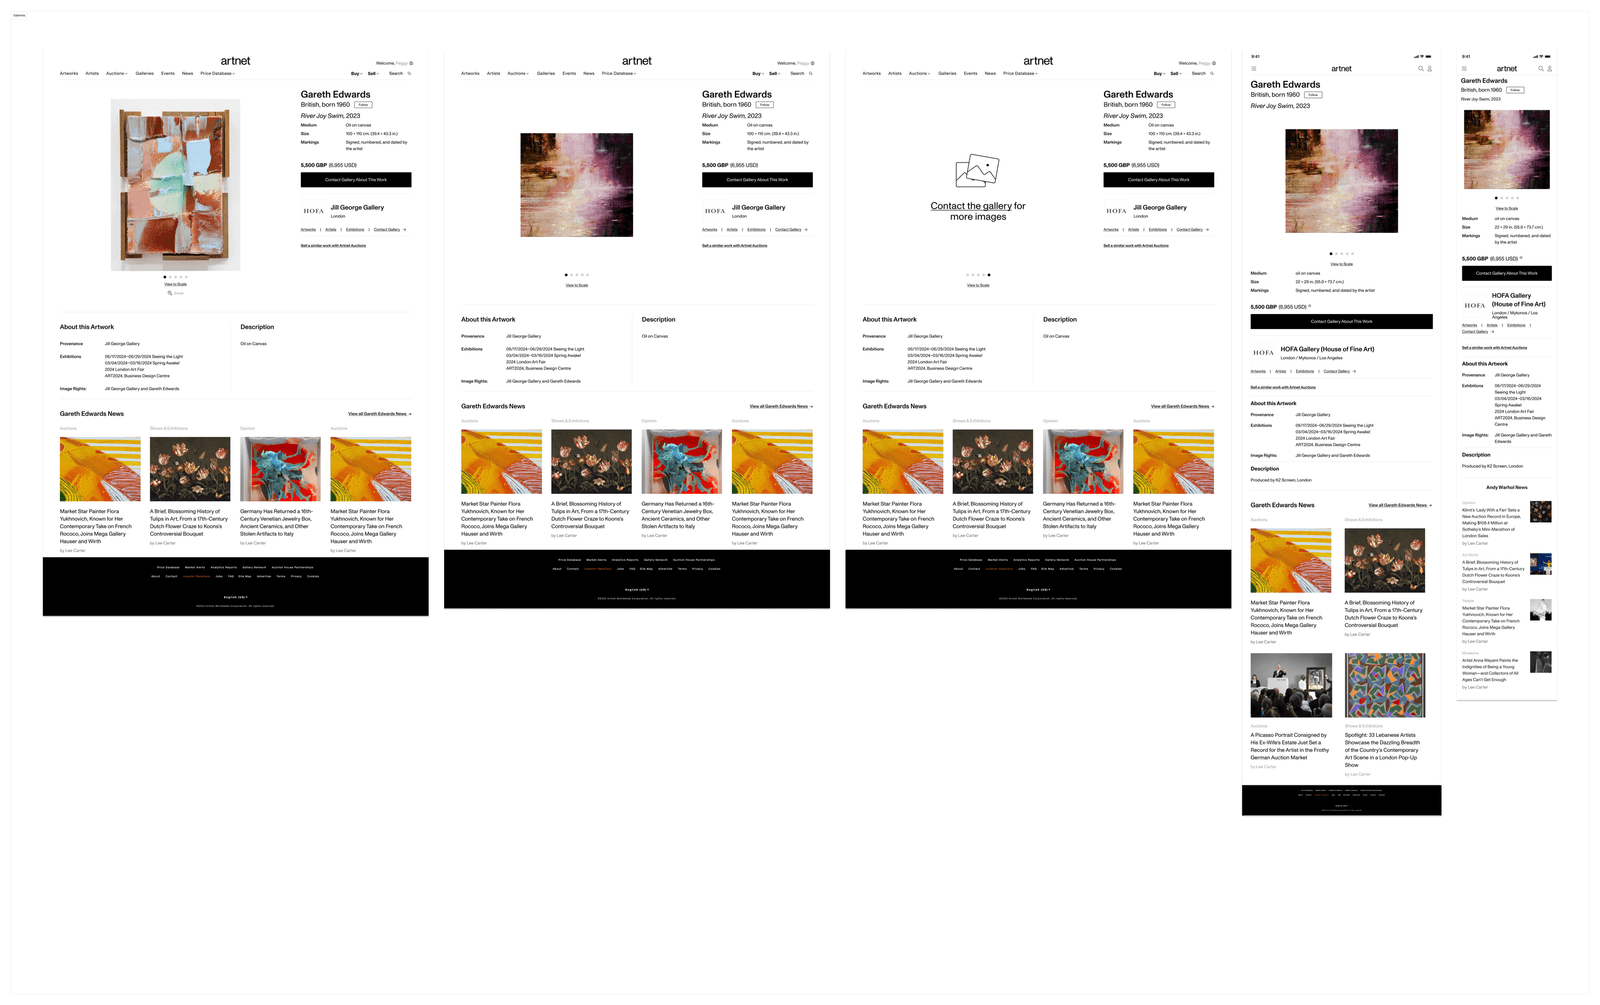
The artwork detail page before and after the redesign, in light and dark treatments, showing a clearer information hierarchy for provenance, market data, and related works.

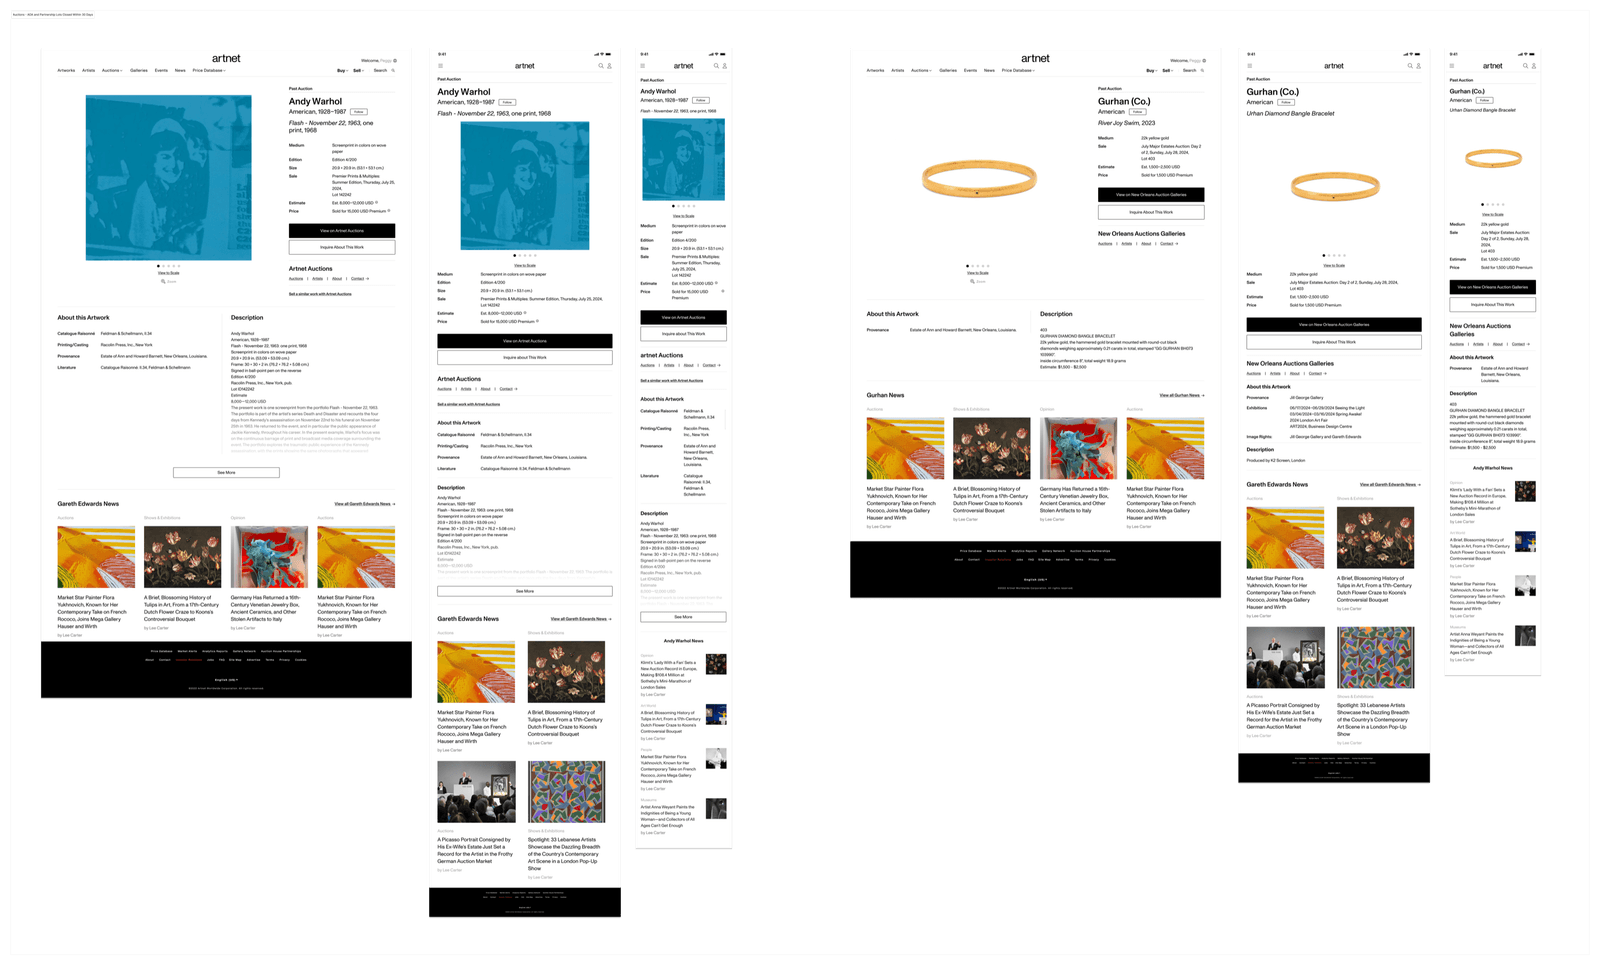
Galleries and auctions carry different fields and market meanings, so the detail page keeps one layout hierarchy while adjusting per source: gallery works lean toward exhibition and background context, auction works toward results and estimates, to avoid visual fragmentation.

Gallery artwork detail page layouts, light and dark.
Auction lot detail page layouts for Artnet Auctions and partnership lots, light and dark.

Gallery work: exhibition and background context.

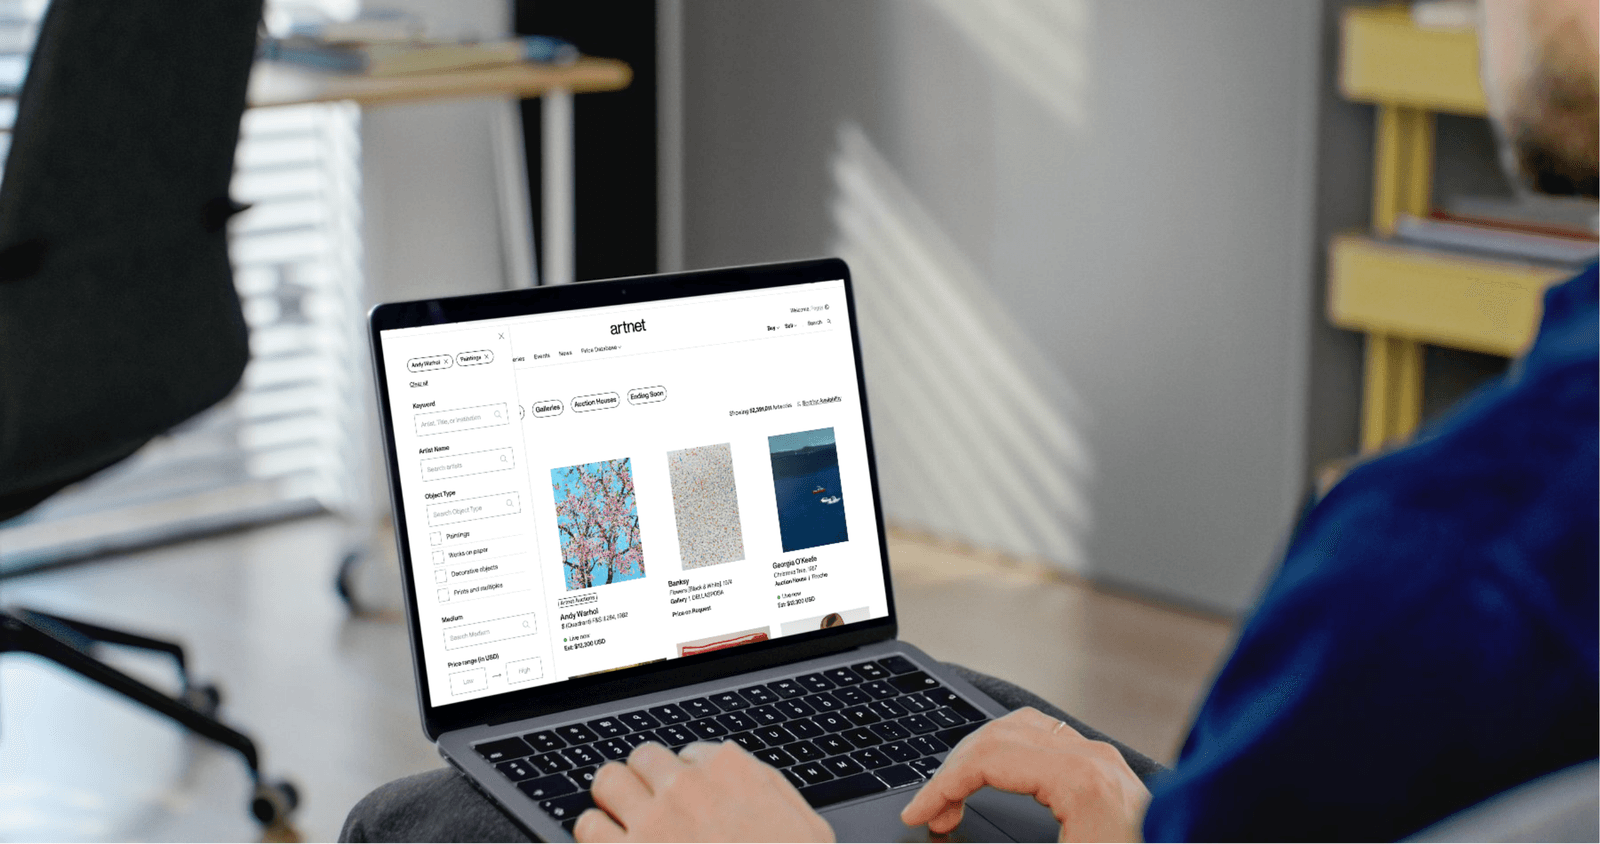
Someone browsing the Artworks Discovery catalogue on a laptop, scanning filtered works in a real working setting.
In real use: browsing a filtered list of works in an actual working setting.

OUTCOMES

Early changes in browsing and exploration behavior

Because this is a newly built Discovery entry point, the following are early signals (early behavioral observations), not a strict before/after comparison. Early observations: average browsing depth rose to about 1.6×, users shifted more from single lookups to continuous browsing, and cross-source switching dropped.

1.6×

Browsing depth

Average browsing depth rose to about 1.6×, with users shifting from single lookups to continuous browsing.

~30%

Monthly return rate (early data)

Used to watch whether one-stop exploration is starting to become a habit, not to represent final growth.

LEARNINGS

Post-launch testing pointed to what to fix next

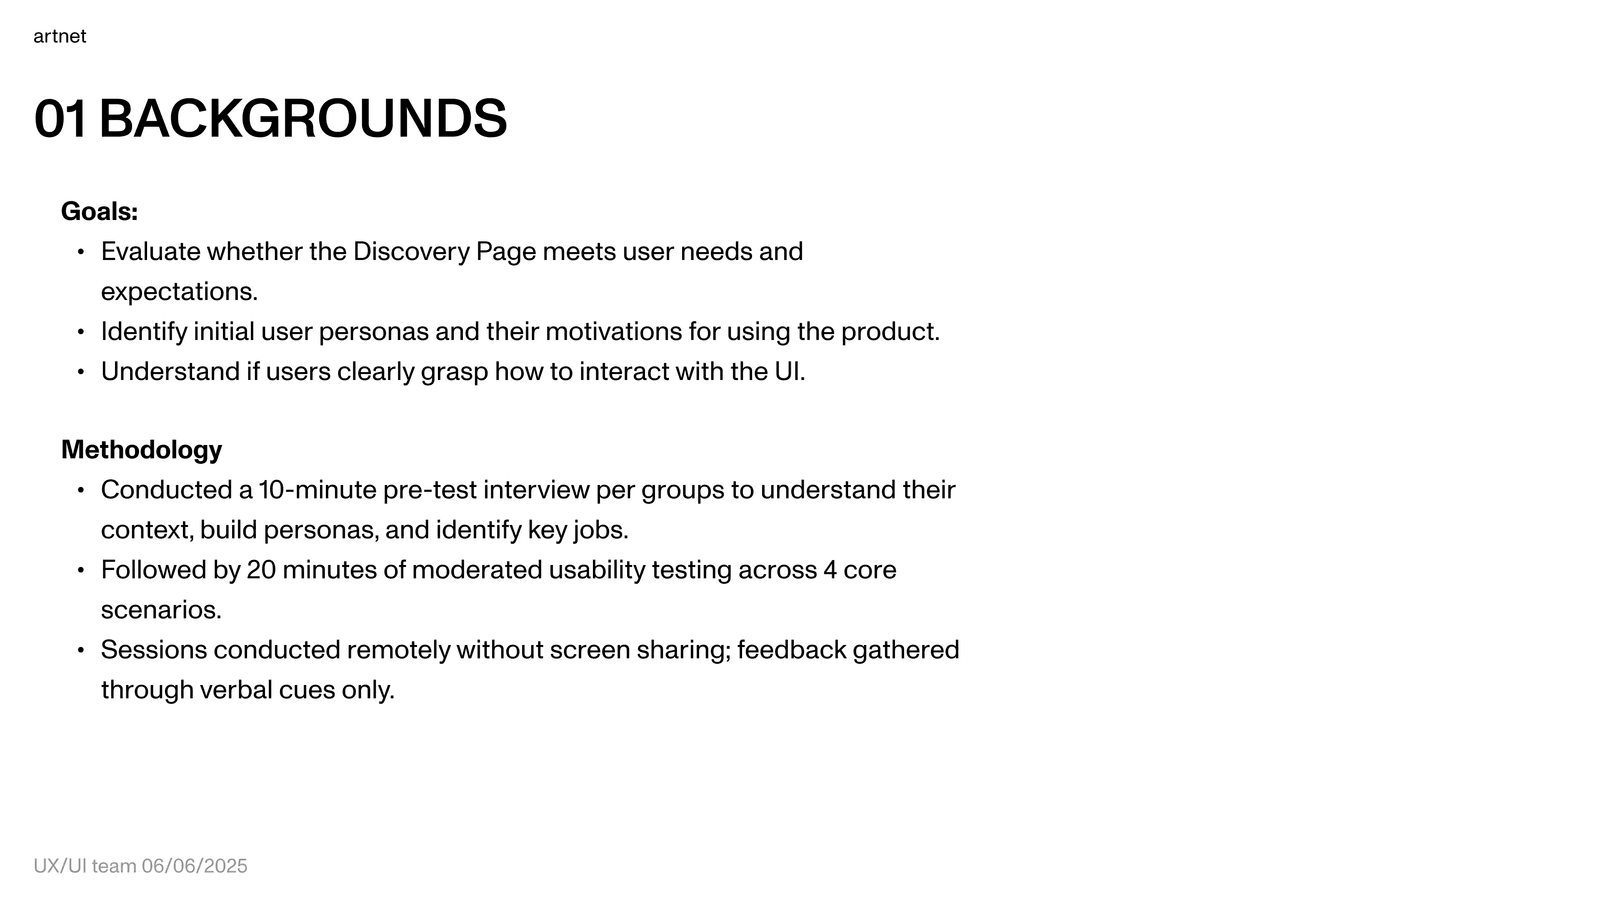
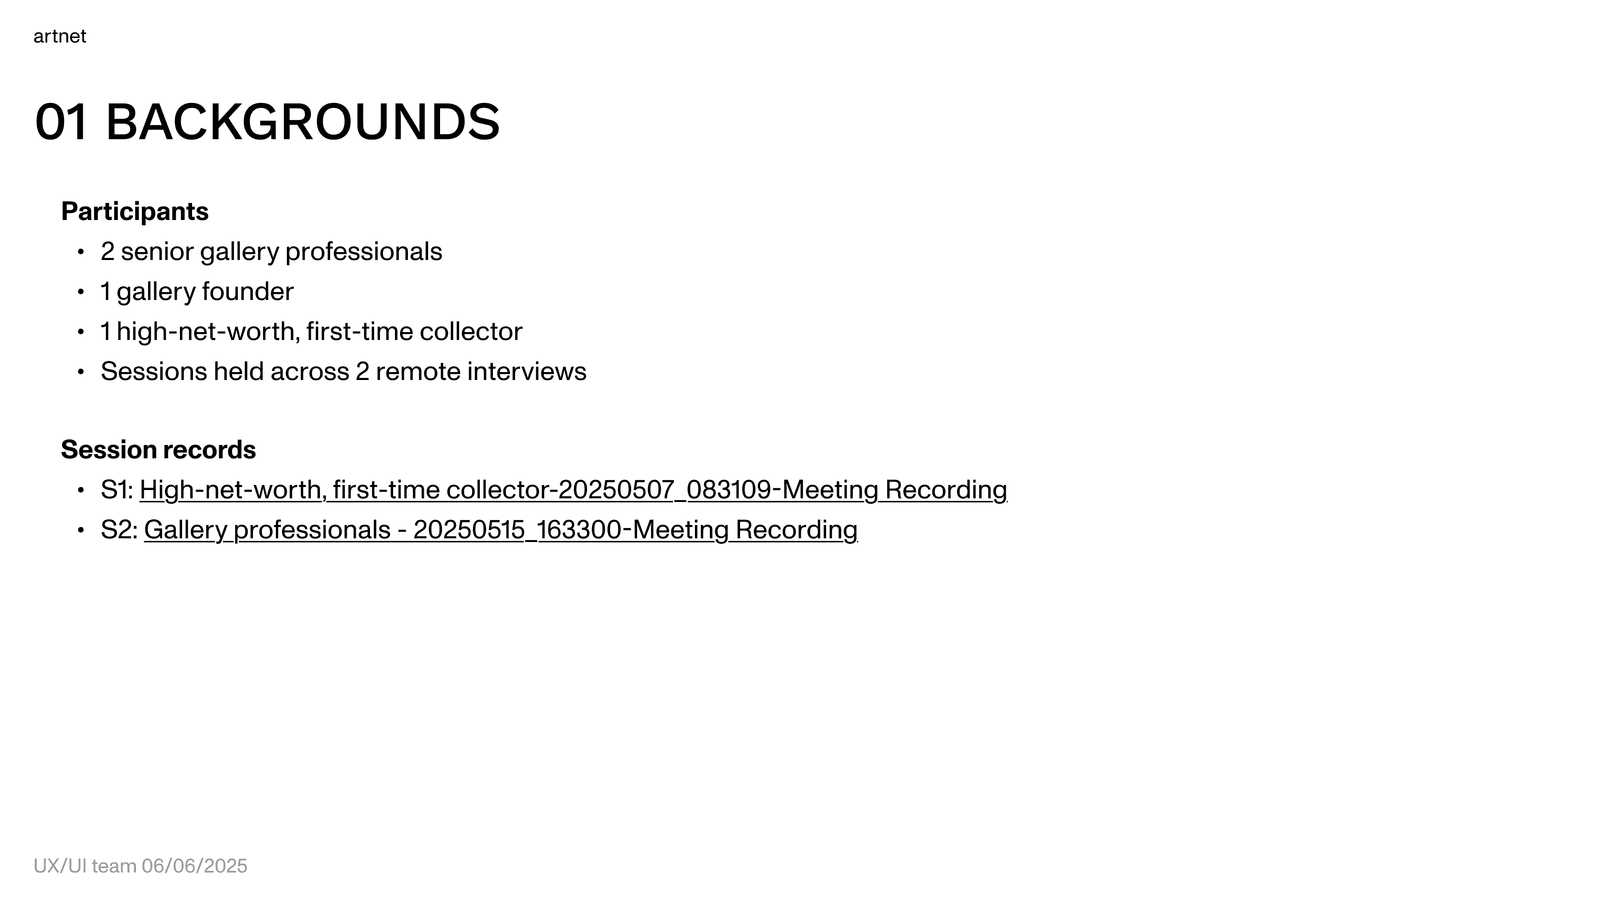
After launch, I ran usability testing with four participants tied to the art market: two senior gallery professionals, a gallery founder, and a high-net-worth first-time collector. Each session combined a 10-minute interview with 20 minutes of hands-on tasks across four scenarios, all conducted remotely.

Three user types on a two-axis model

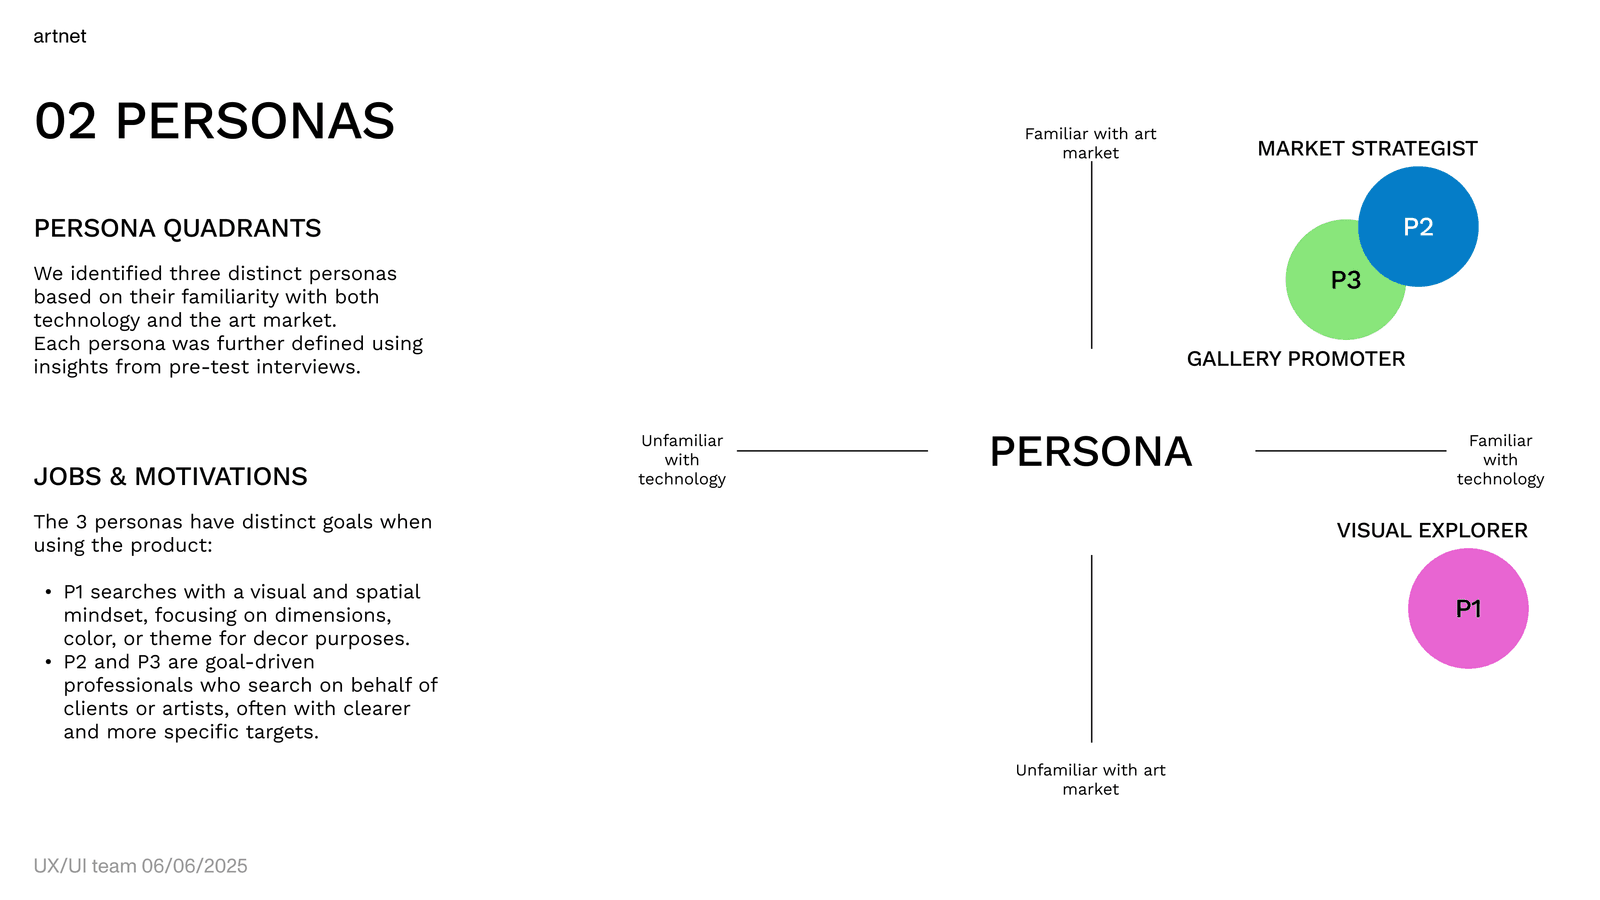
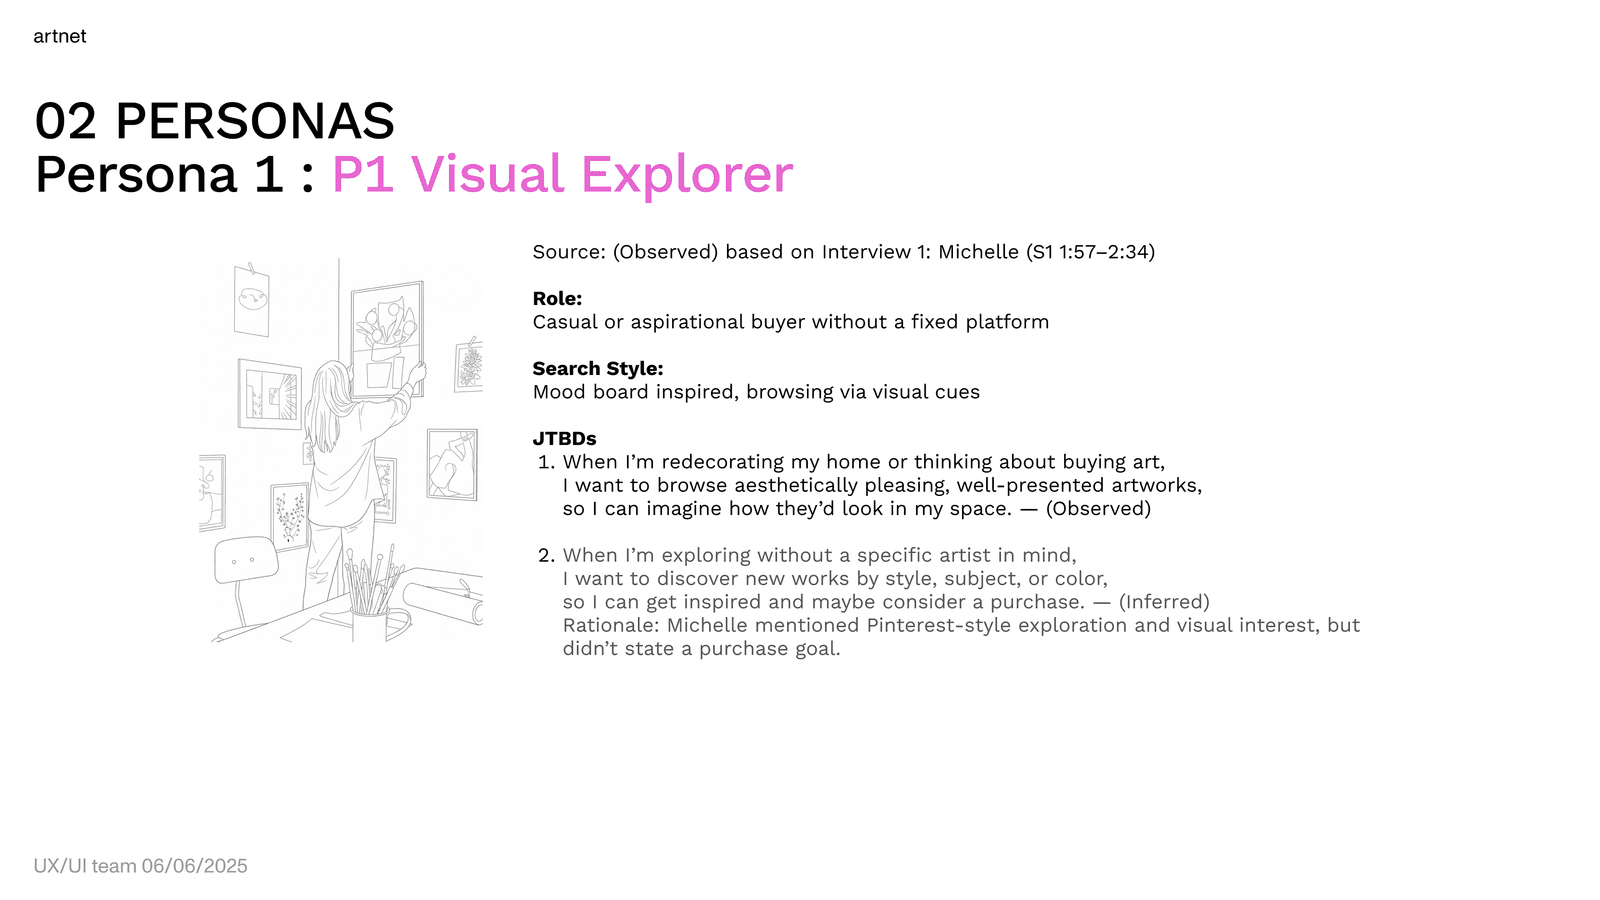
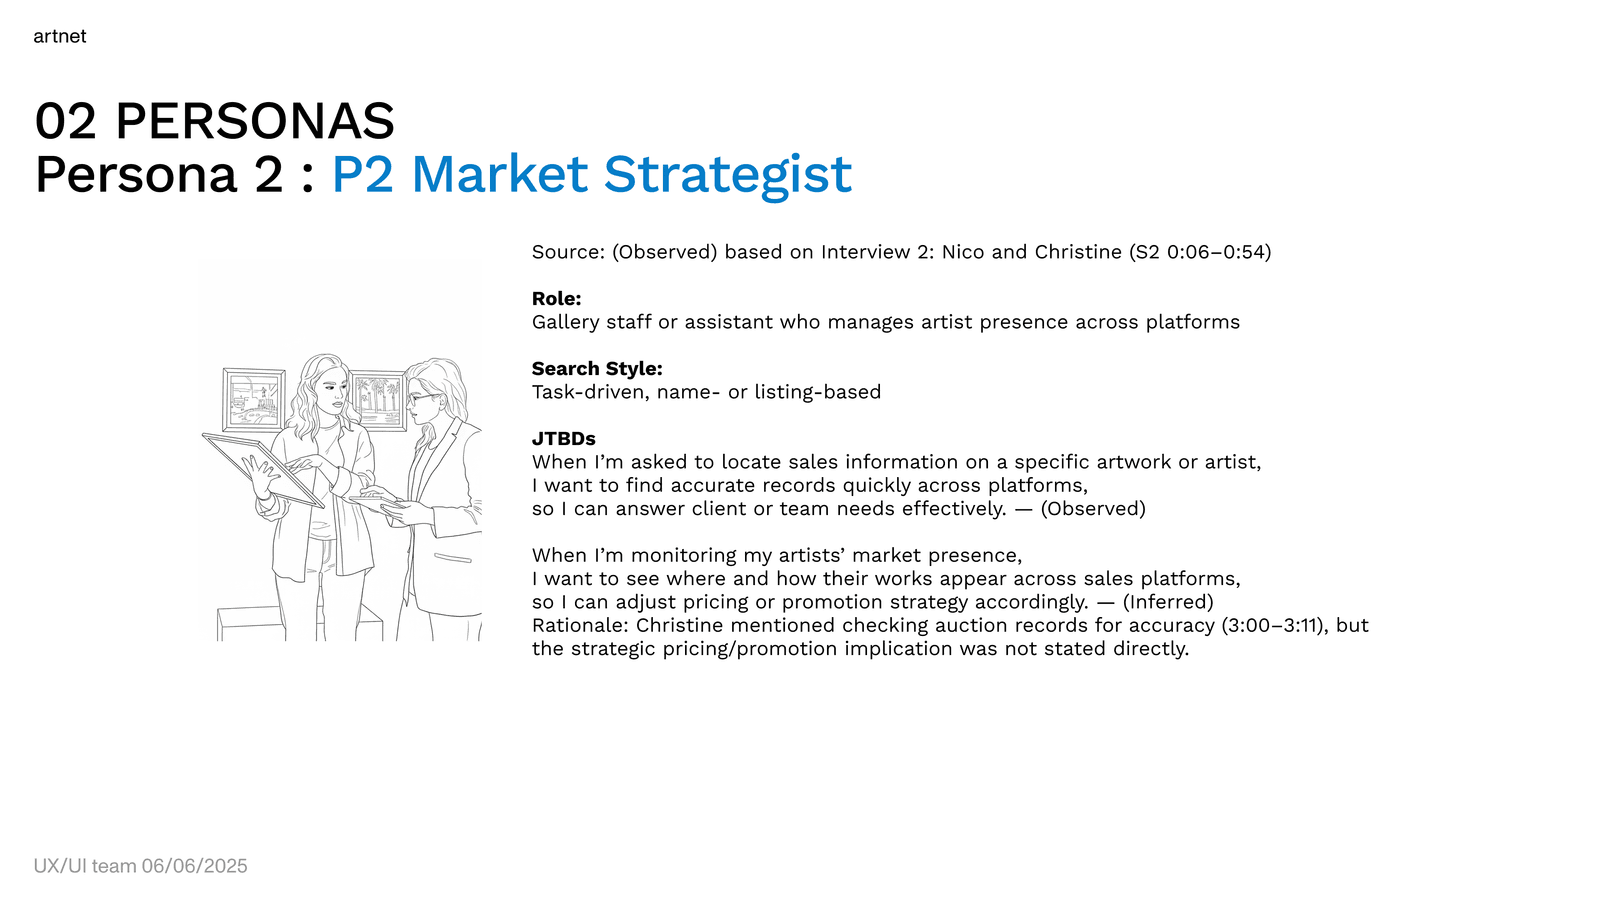
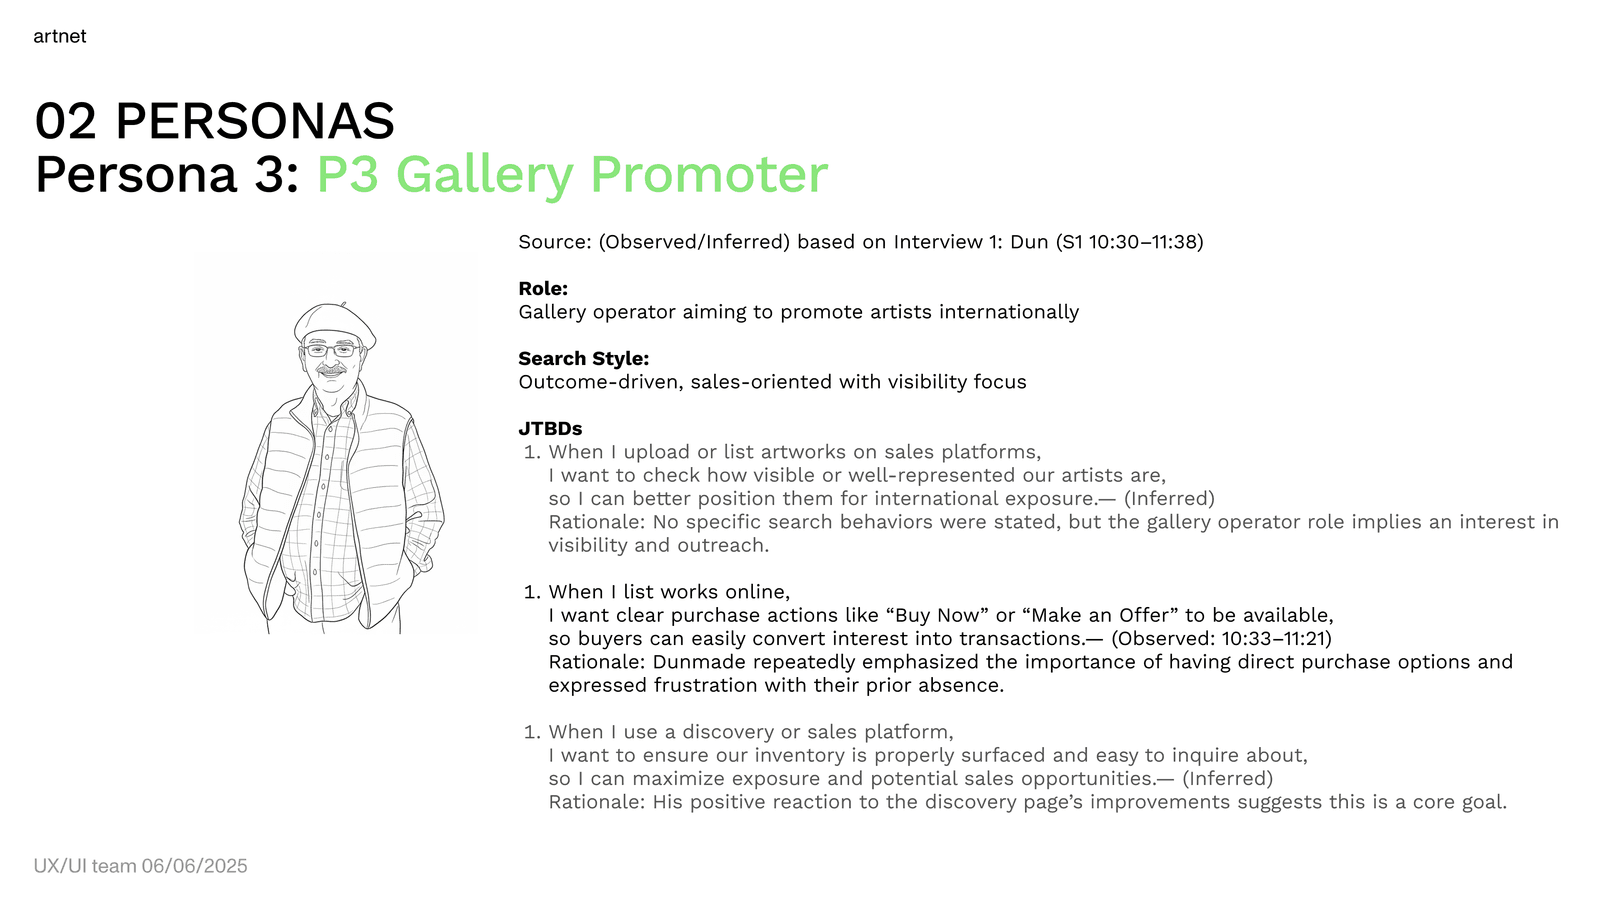
I analyzed behavior on two axes, familiarity with technology and familiarity with the art market, and arrived at three main user types: the Visual Explorer (browses by style and visual instinct), the Market Strategist (searches by work name and market info), and the Gallery Promoter (focused on artist exposure and visibility).
Stable overall, but one task broke down

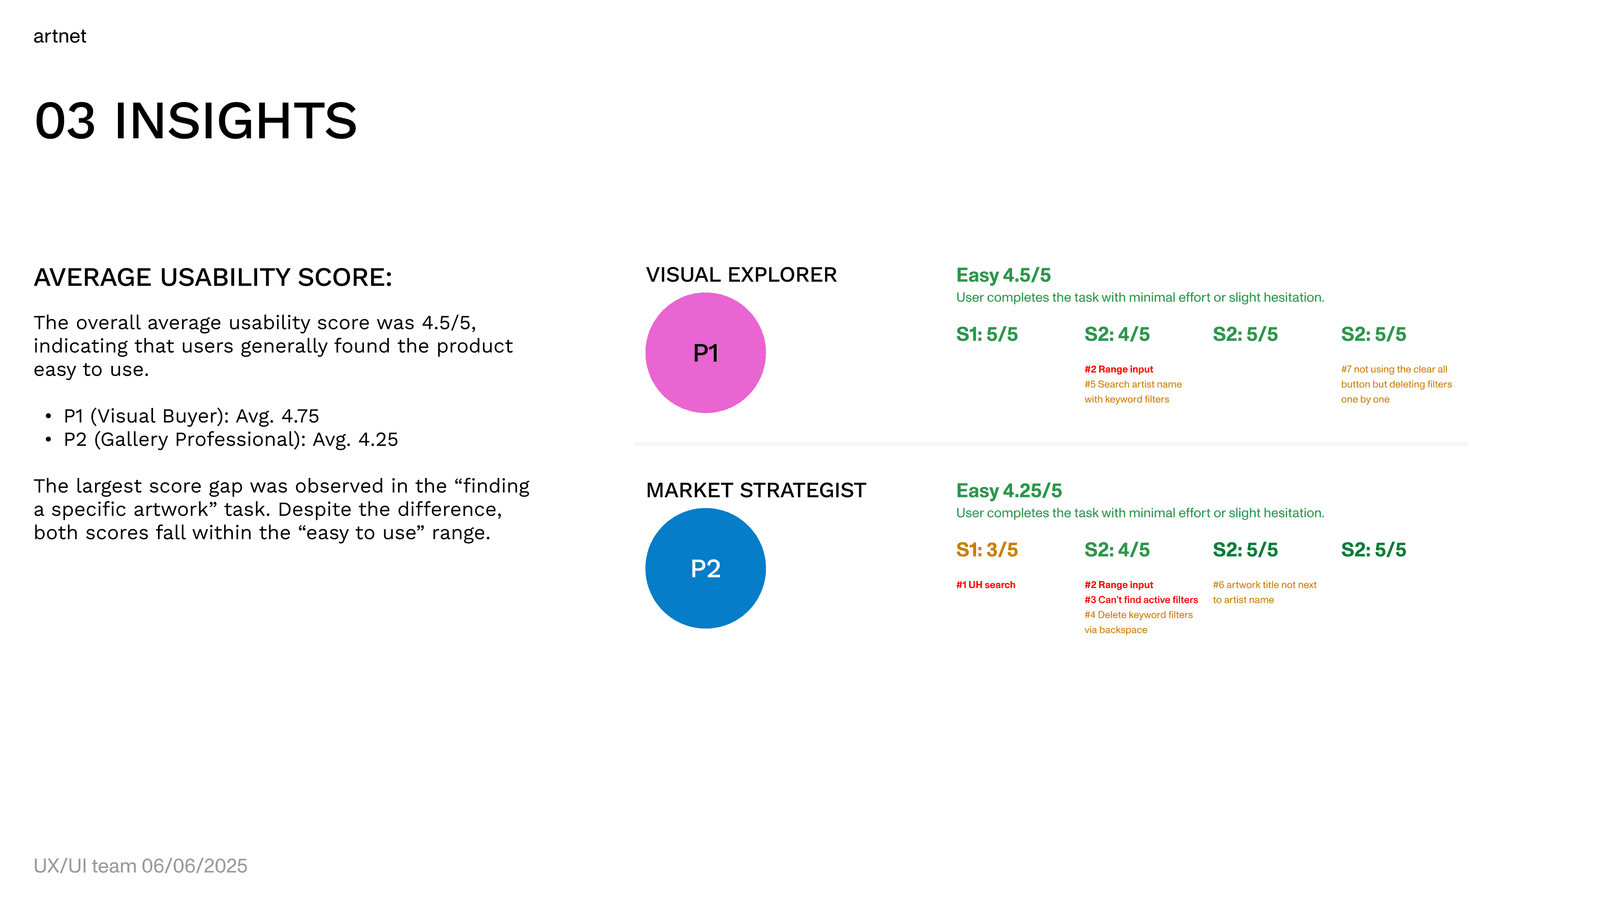
Usability was stable overall (4.5 / 5), but one task showed a clear drop. The key problem concentrated on finding a specific work, the only clear break point across the four scenarios.

The core issue is a system boundary

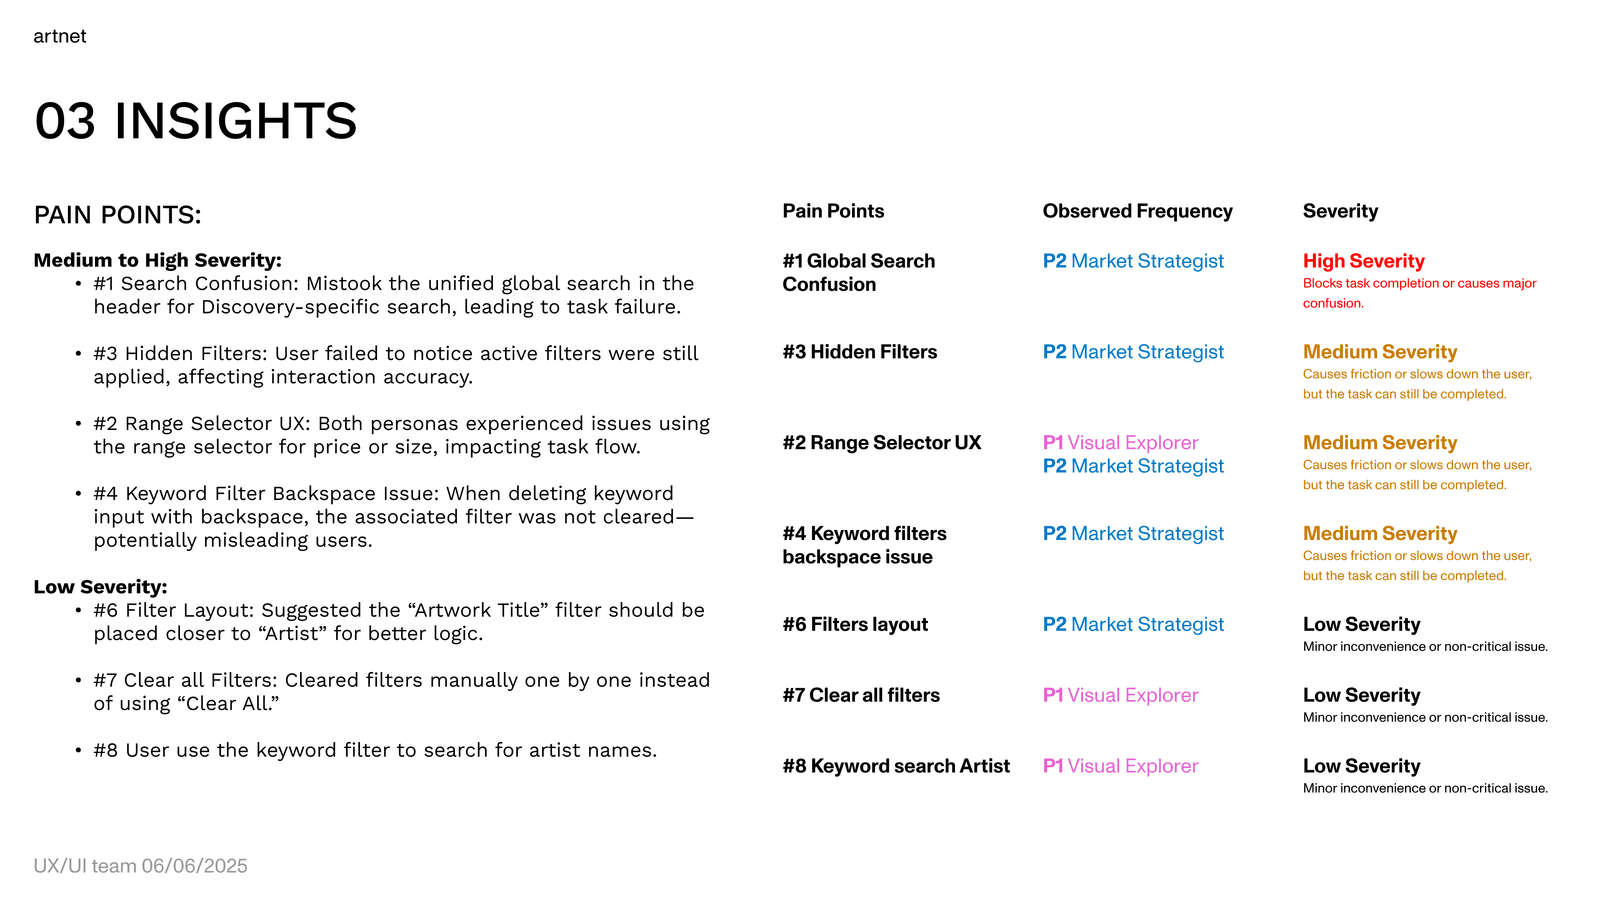
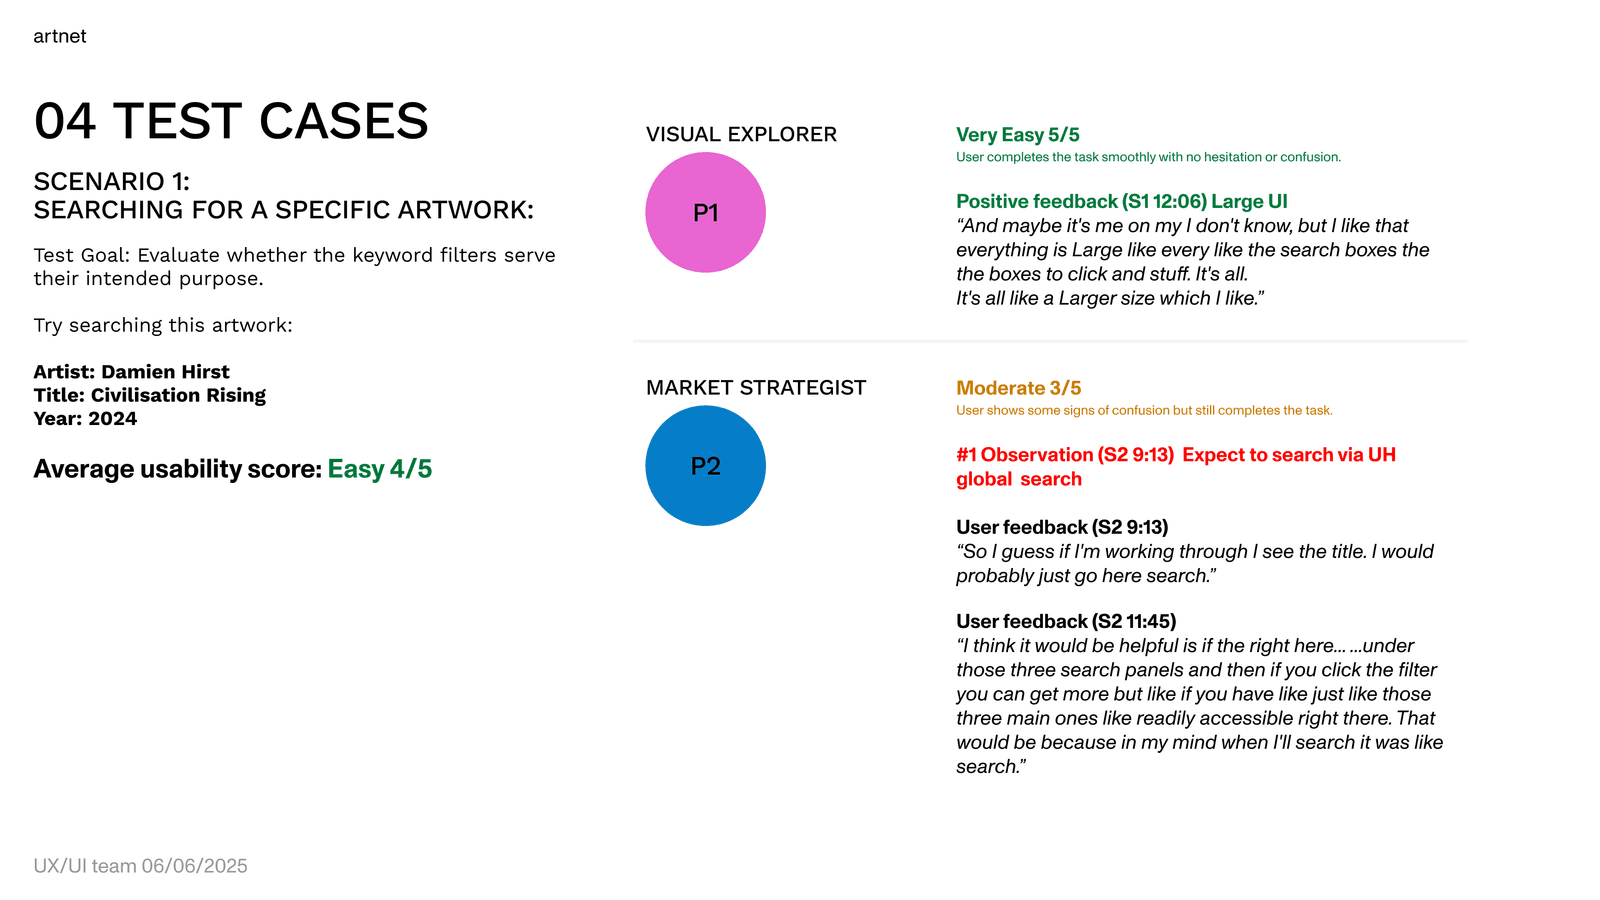
The most severe problem was a mental-model error: users assumed the header's global search equaled the Discovery page search, but the two have different scopes. That led to wrong search paths, missing results, and failed tasks.

The full research report walks through, in order, the method, the three user personas, the core insights, and the four contextual test scenarios.

Discovery page usability testing report, page 1: Background: research goals and method.
Discovery page usability testing report, page 2: Participants and session records.
Discovery page usability testing report, page 3: Three user personas on a two-axis model.
Discovery page usability testing report, page 4: Persona 1, the Visual Explorer.
Discovery page usability testing report, page 5: Persona 2, the Market Strategist.
Discovery page usability testing report, page 6: Persona 3, the Gallery Promoter.
Discovery page usability testing report, page 7: Insights: usability scores by persona.
Discovery page usability testing report, page 8: Insights: eight pain points, ranked by severity.
Discovery page usability testing report, page 9: Scenario 1, finding a specific artwork.
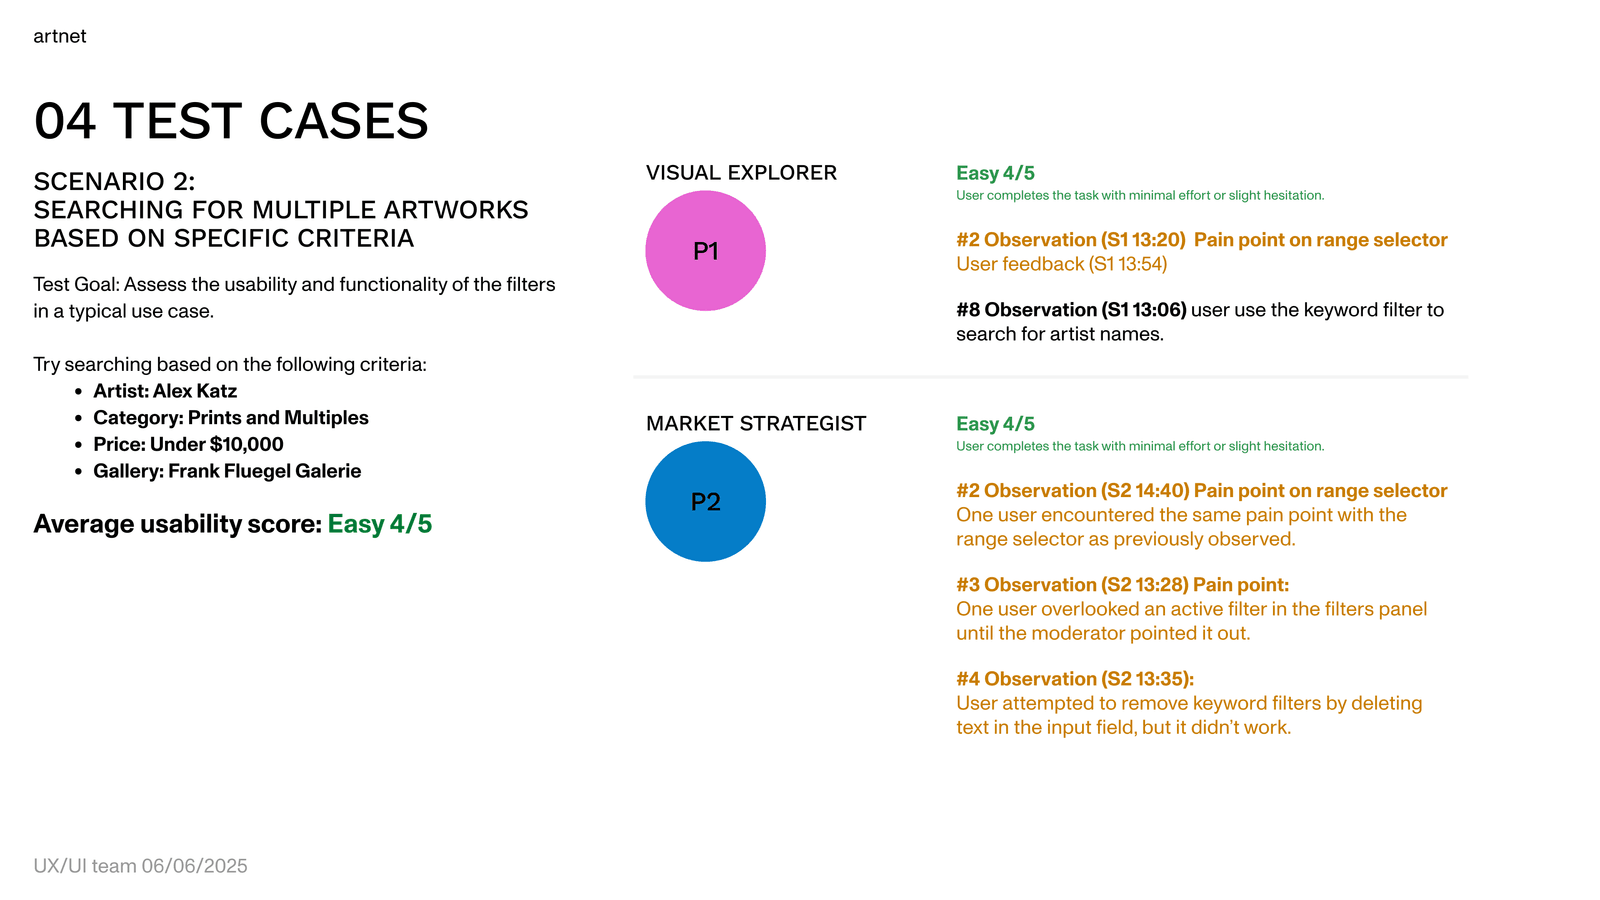
Discovery page usability testing report, page 10: Scenario 2, advanced search by multiple criteria.
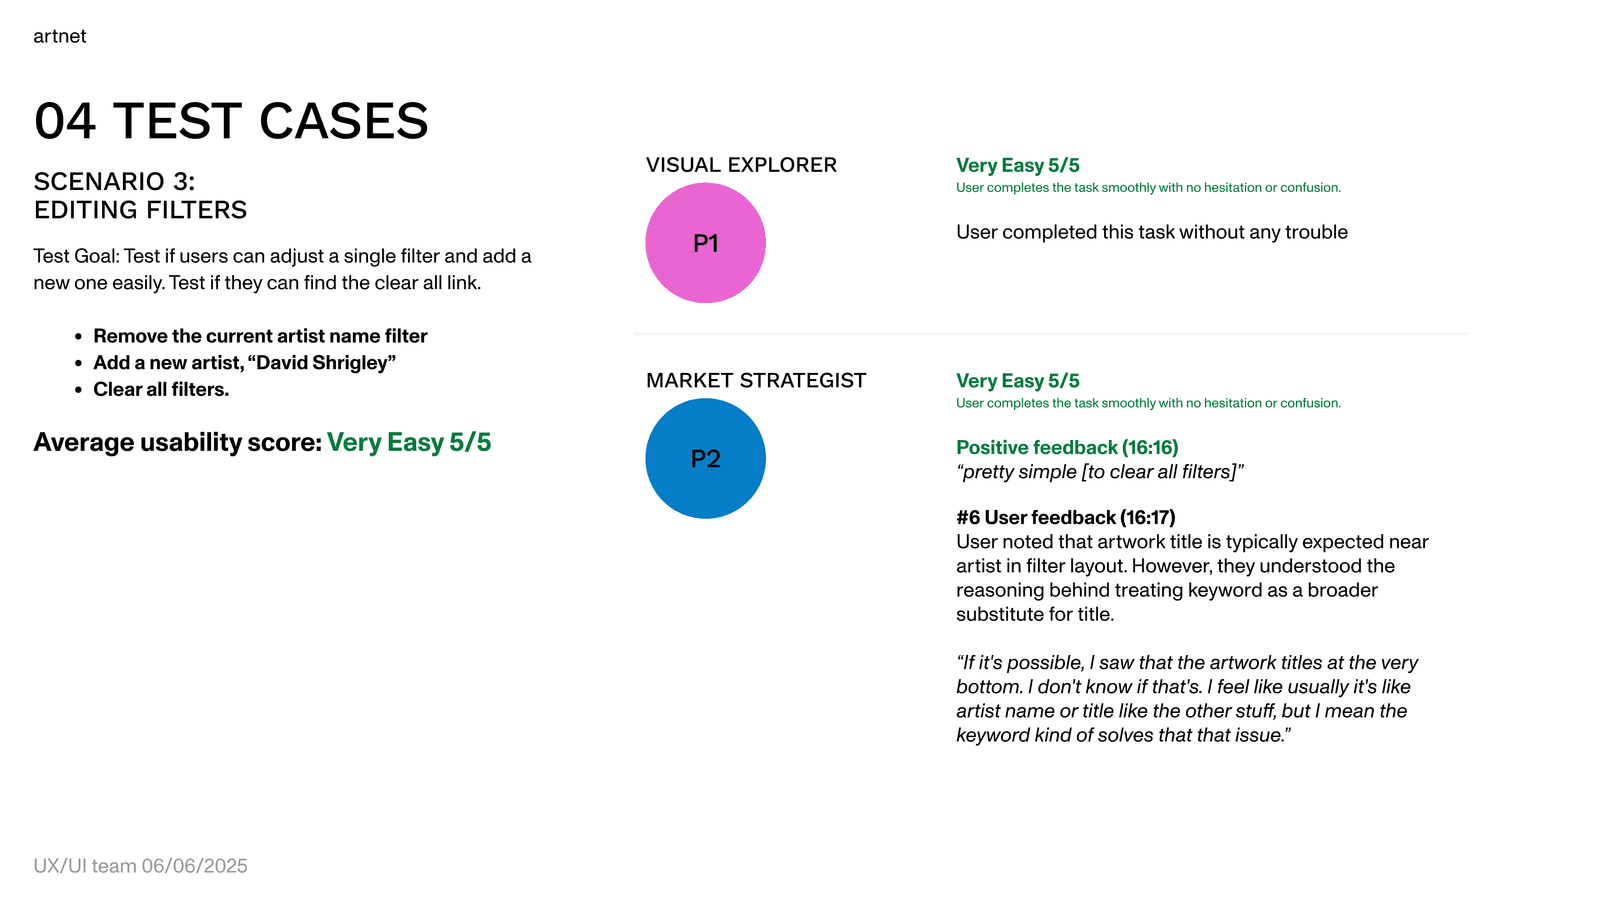
Discovery page usability testing report, page 11: Scenario 3, editing and adjusting filters.
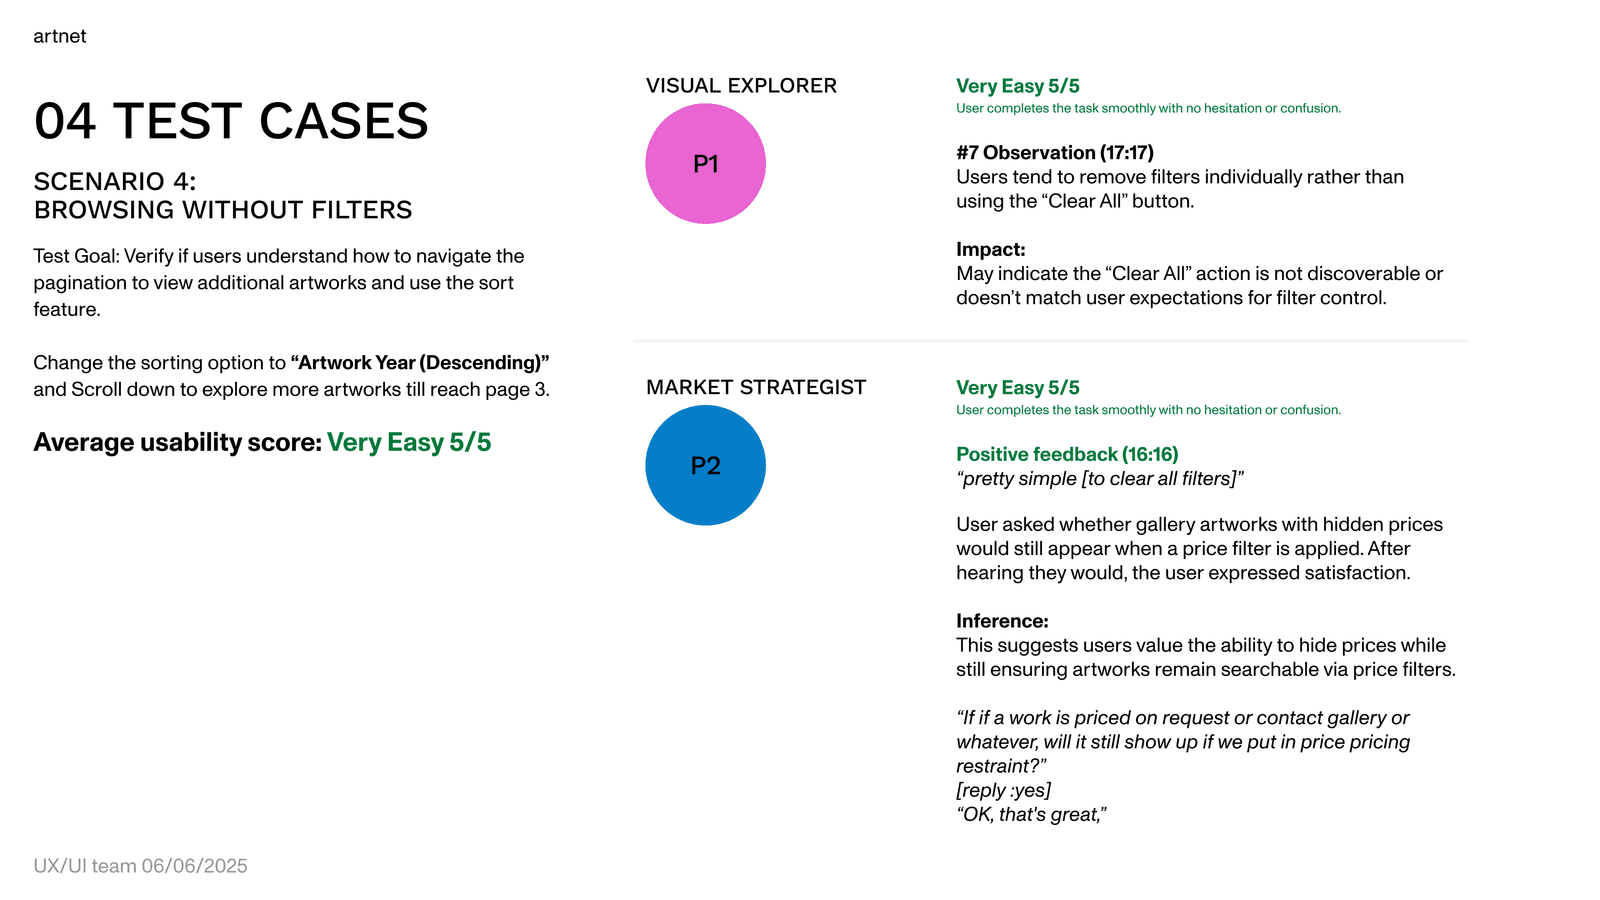
Discovery page usability testing report, page 12: Scenario 4, free browsing without filters.
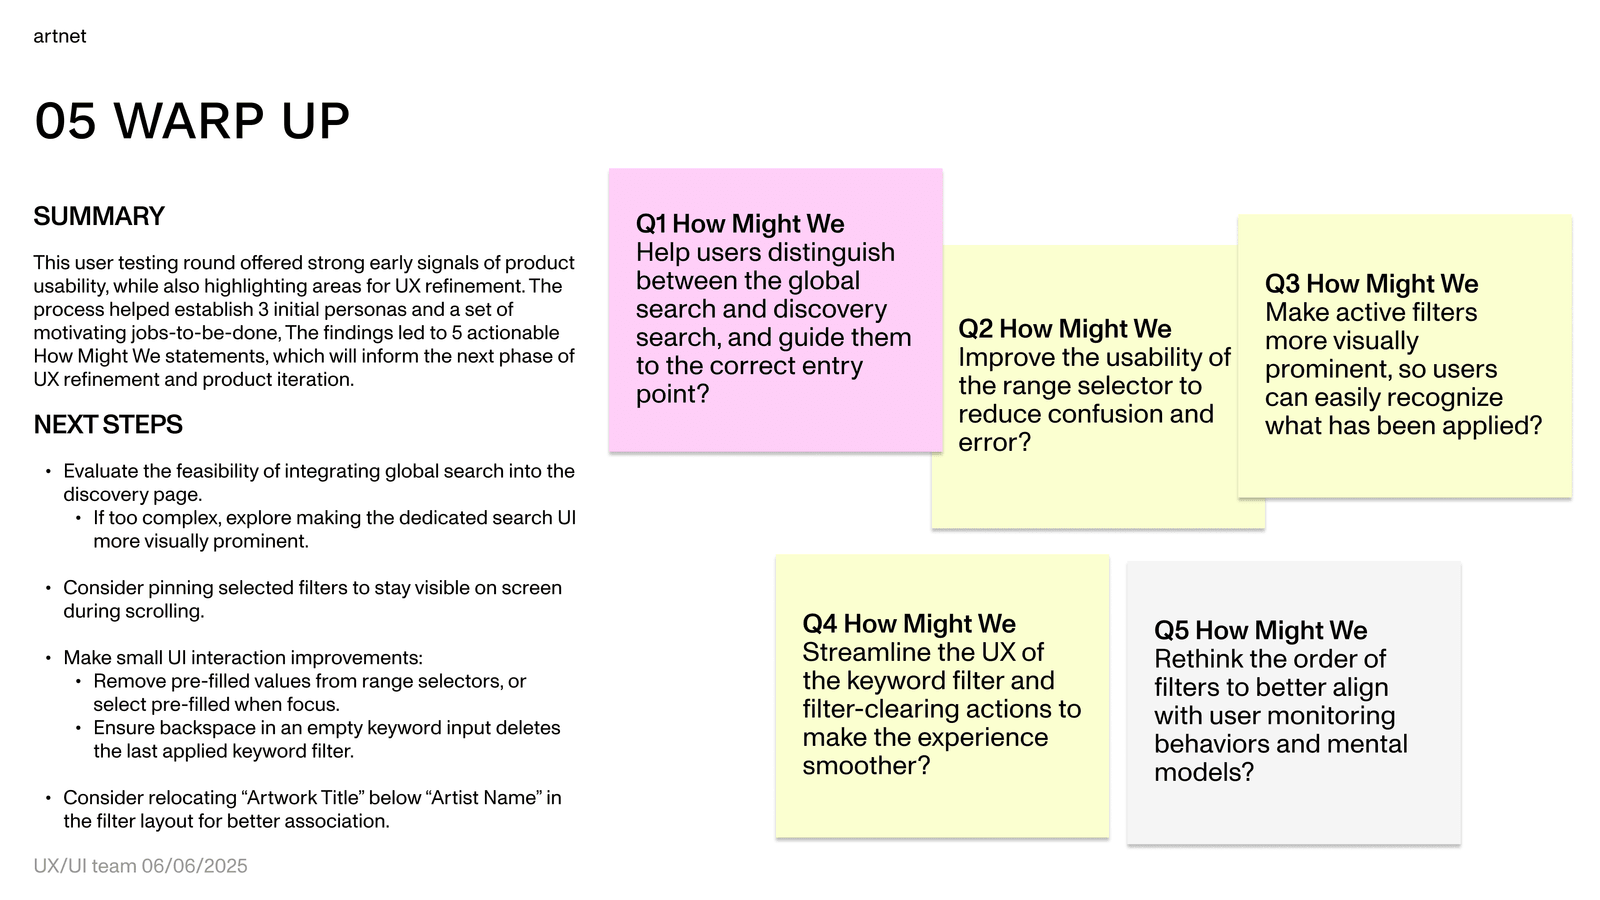
Discovery page usability testing report, page 13: Wrap-up: five How Might We questions and next steps.

1 / 13 Background: research goals and method.

What to fix next

The testing confirmed the core issue was a misread of the system boundary. So the priorities were:

  1. Fix the mental model between the global search and the Discovery page search.
  2. Refine the search and filter interactions.
  3. Fine-tune visual details.

The boundary of the conclusions matters more than the conclusions

The four participants leaned toward gallery-side users, so the results describe a specific professional group, not the whole market. The value of the research is in clearly defining the scope its conclusions apply to.

And the deeper takeaway: designing a cross-source system is, at its core, designing how users understand information sources, and what those sources mean in different market contexts.