Praxis: An AI trading evaluation workspace
OVERVIEW
Overview
Praxis is a personal project built on top of Freqtrade, an open-source quant-trading framework. The goal is simple:
turn a scattered process of strategy backtesting and evaluation into one workspace where strategies can be understood and compared quickly.
In today's workflow, AI can already generate trading strategies very fast. But that creates a new problem: once there are many strategies, the real bottleneck is no longer writing them, it's reading them.
Each strategy still needs its backtest results re-read, its trading behavior understood, and its versions compared, before deciding whether it should move to the next stage (dry run / paper trading). As the number of strategies starts to grow fast, that evaluation becomes the main cost.
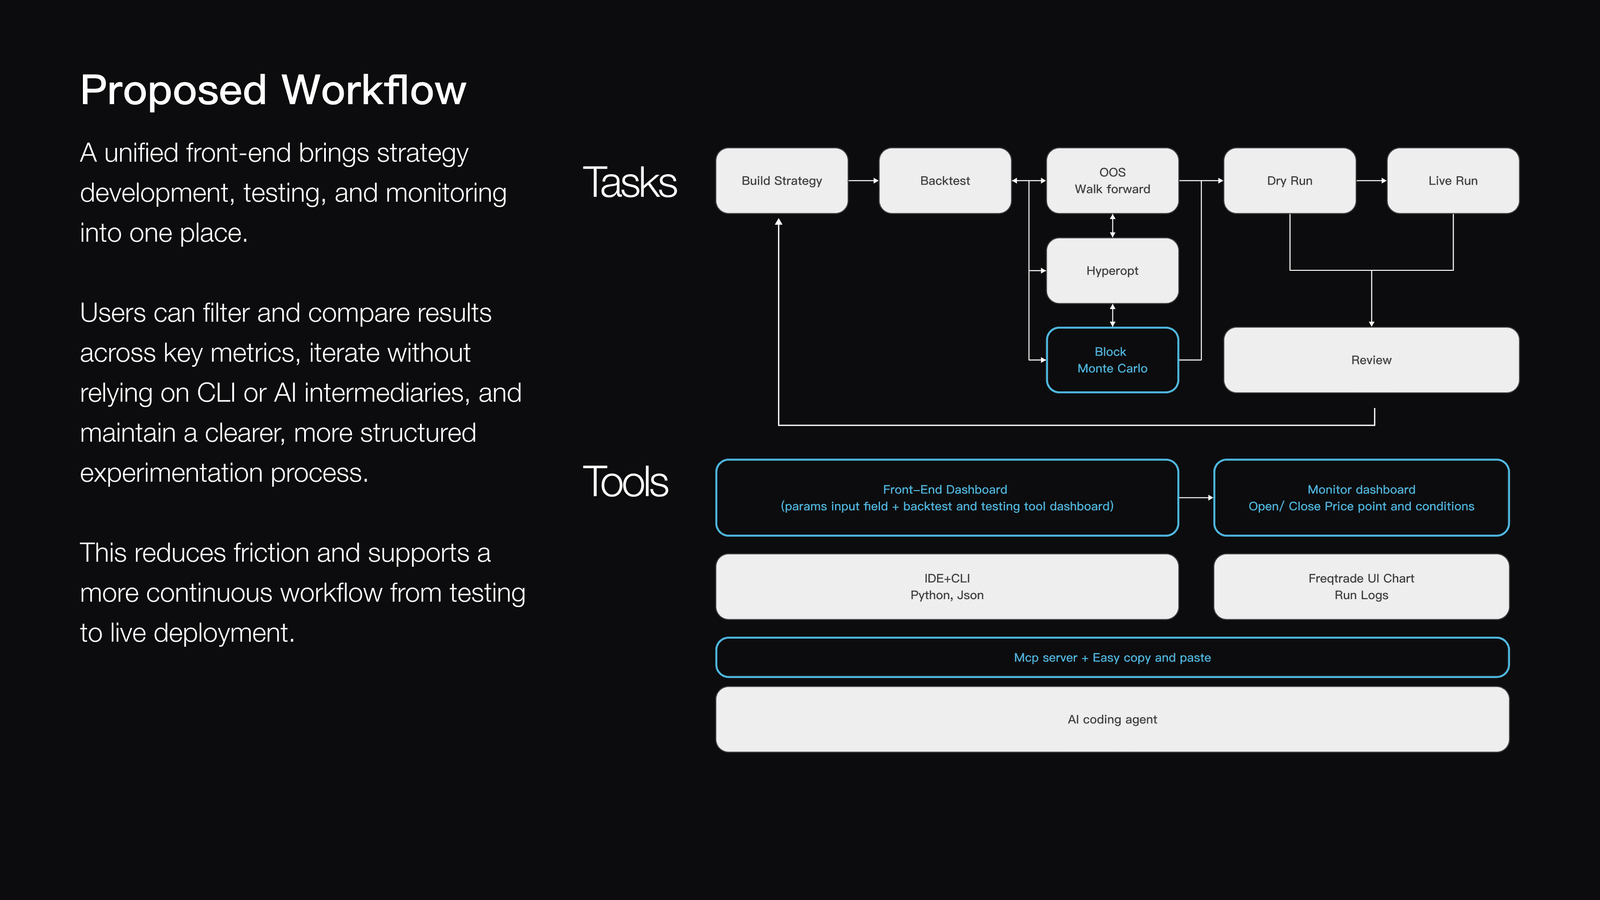
That is the part Praxis is built for. It pulls all the backtest output and strategy information into one unified interface, so strategies are faster to understand, easier to compare, and easier to decide on.
- Role
- Product Designer
- Time
- 2 weeks
- Team
- Solo project
- Impact
- Evaluation time: ~3d to ~1.5d
Strategy exploration density: ~2×
A single source of truth
DISCOVER
AI sped up generation, but evaluation became the bottleneck
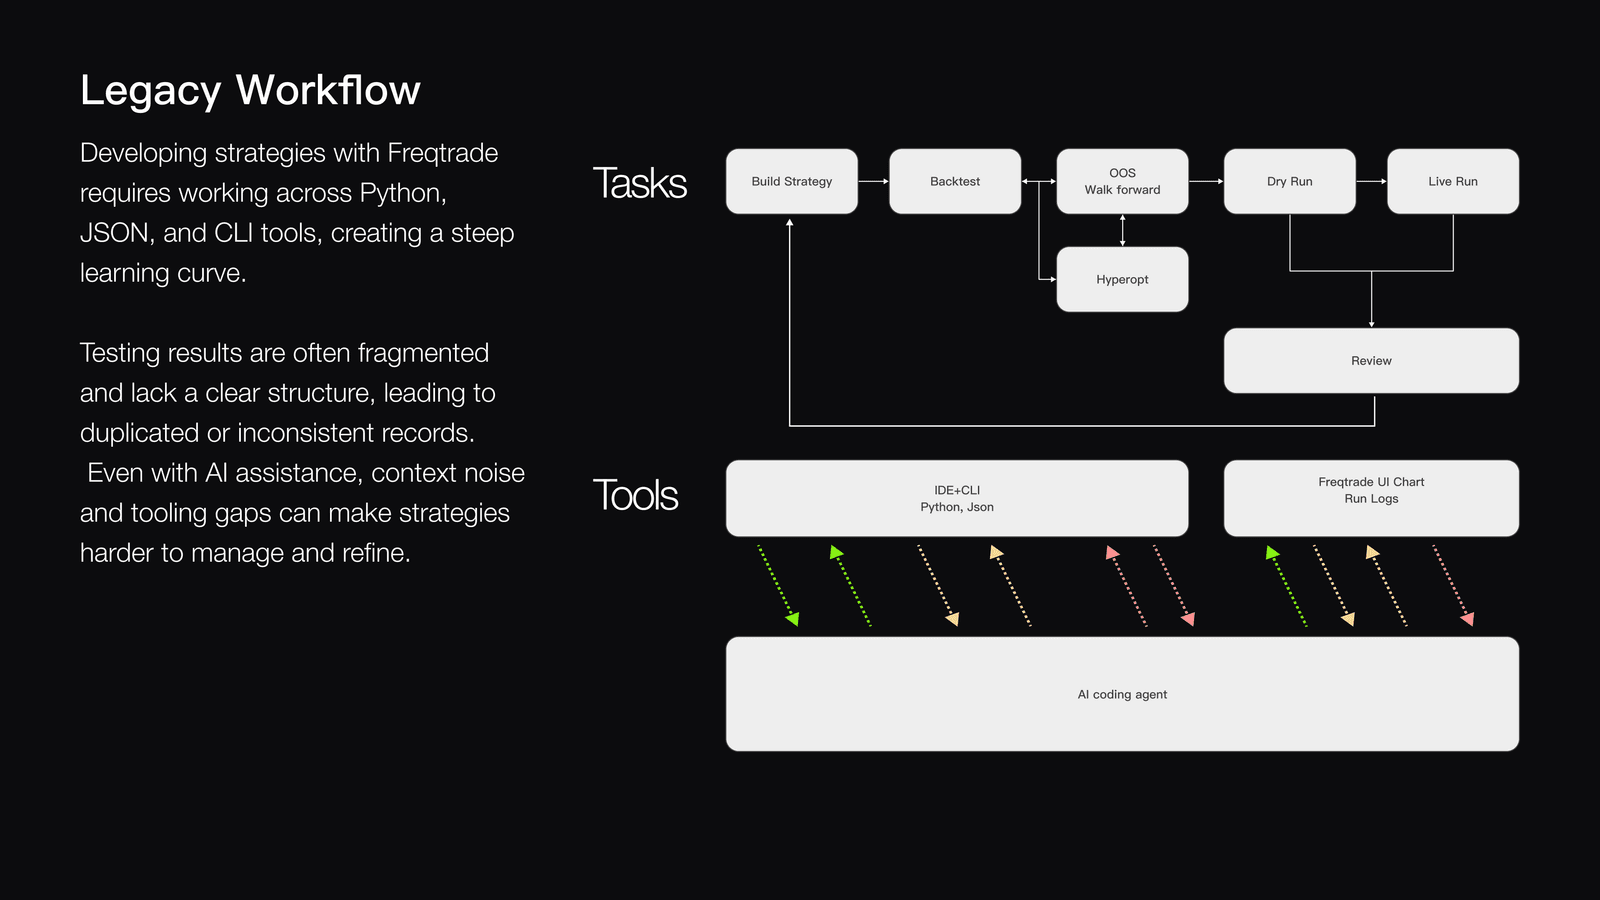
This project came from a problem I ran into doing quant trading myself. AI makes writing strategies very fast: you can generate many different versions in a short time.
But the catch is that the understanding and judgment afterward did not get any faster. Each strategy still has to be read from its backtest log, its trade records reviewed, its versions compared, its stability judged. Once there are more and more, this quickly becomes the choke point.
Core issue
The real bottleneck is understanding and validation.
And the way the work is spread out today:
- backtest logs in the terminal
- strategy config in JSON
- per-version strategy code
- switching back and forth between tools
None of it is connected. The result: you are actually making a decision, but what you see is a pile of fragments.
DEFINE
What I wanted to solve is the evaluation layer itself
Problem statement
When I evaluate a strategy across scattered tools, I want to run, compare and read it in one place, so I can trust the result without fighting the tooling.
HMW
How might we let a trader read, compare and trust AI-generated strategies in one workspace?
Constraints
- Has to run inside the local Freqtrade environment.
- Strategies and backtest results need to be persisted, not left to the LLM.
- The system has to emphasize traceability.
- With only two weeks, it can only be an MVP, not a full platform.
Principles
- Every strategy has to be traceable and comparable.
- Information should be transparent, not a black box.
- Reduce the cost of switching between tools.
- Keep the analytical depth professional users need.
- Solve evaluation efficiency first, not add features.
DEVELOP
Consolidating scattered strategy data into one workspace
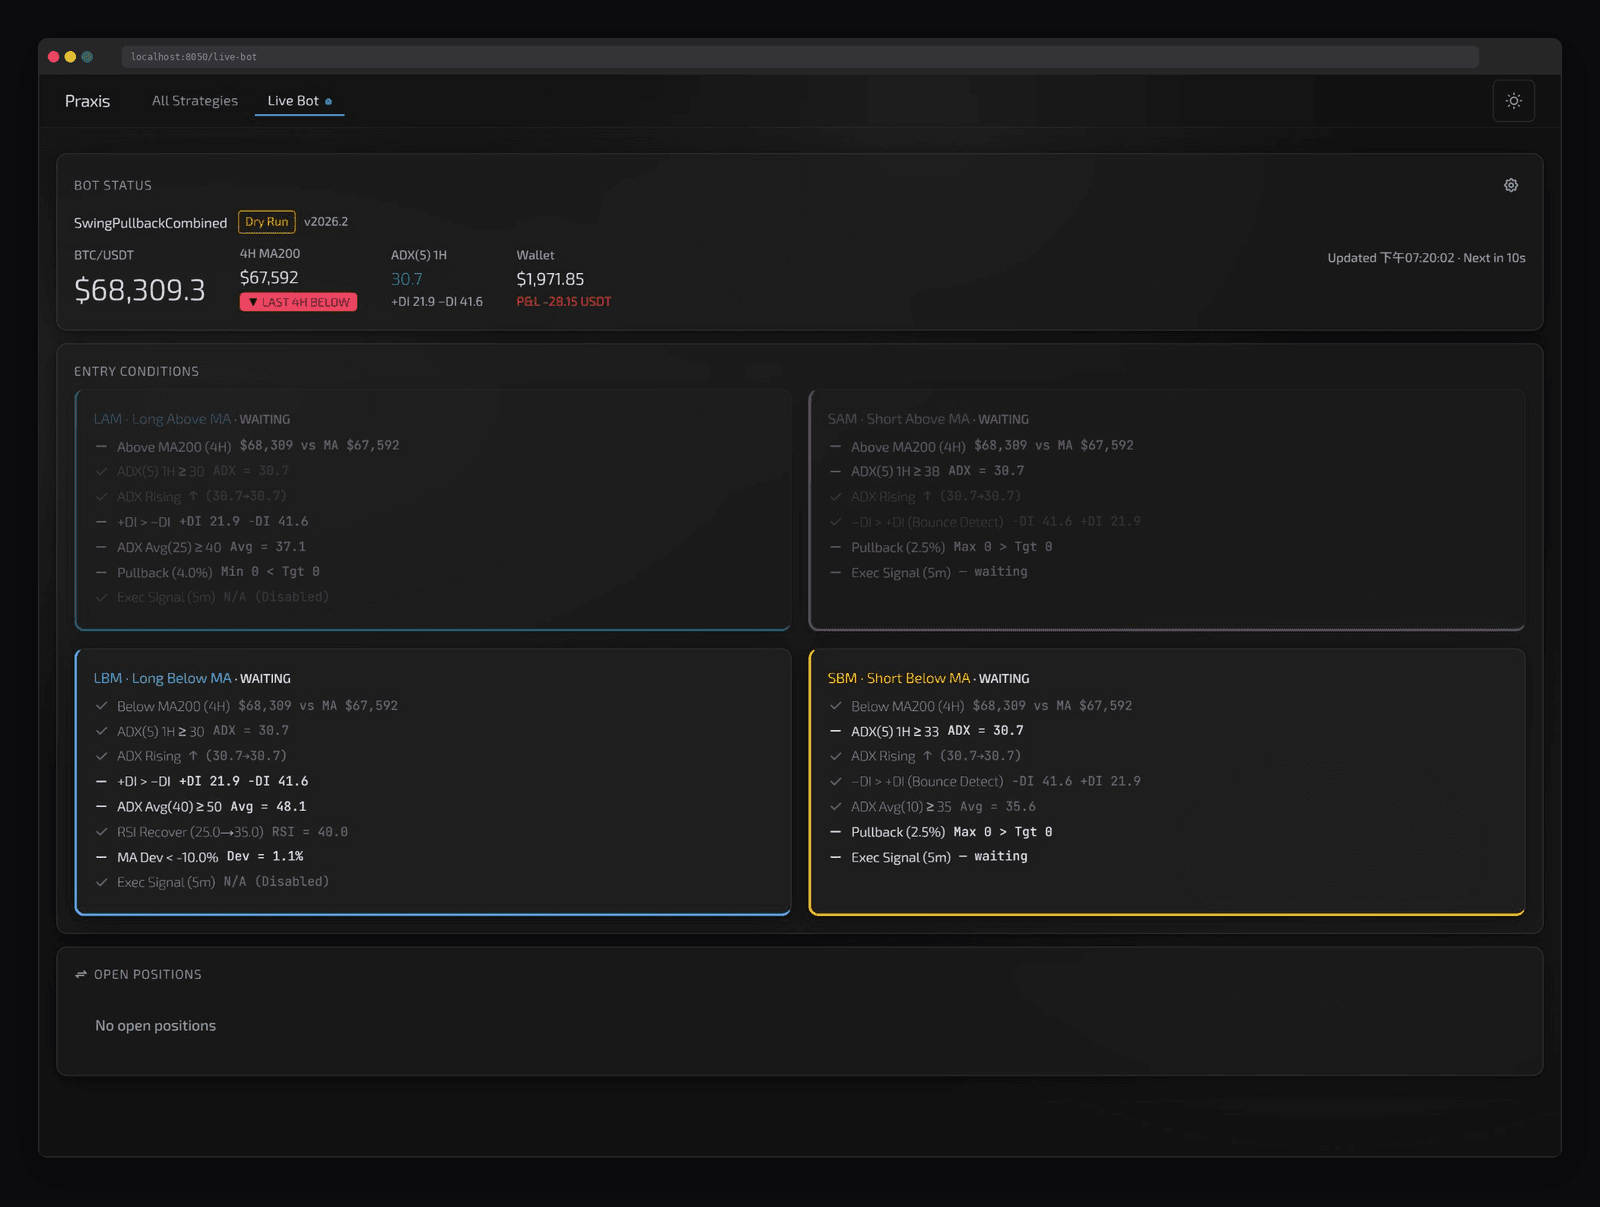
I did not change Freqtrade's own architecture. I added a layer of front-end workspace on top of it, turning all the strategy output into something that can be viewed in one place.
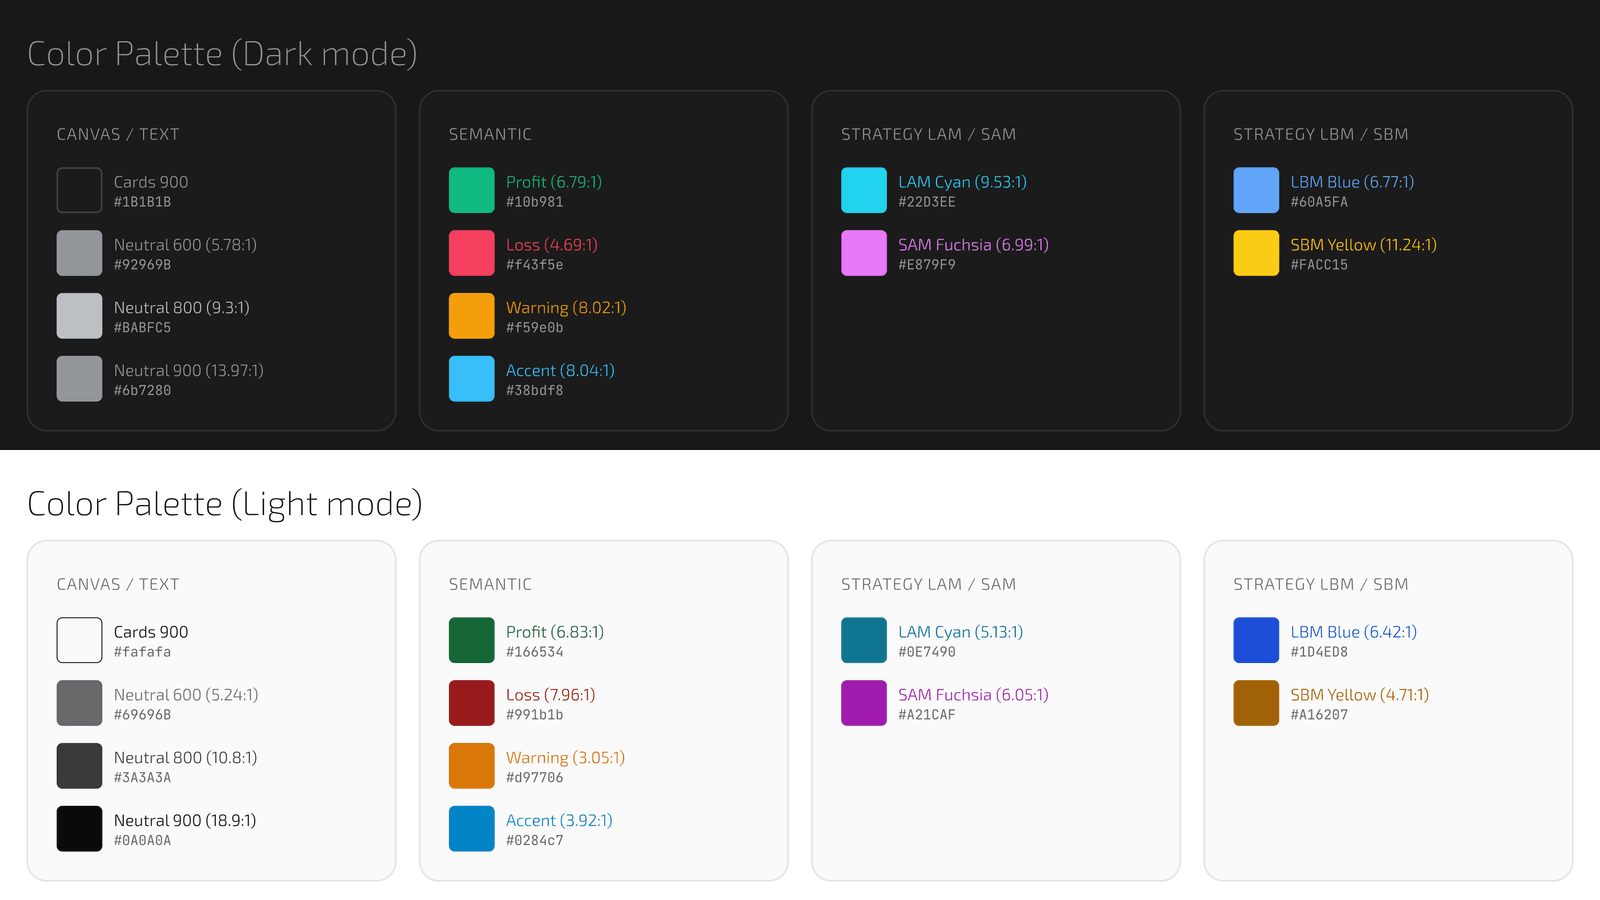
Color system and accessibility
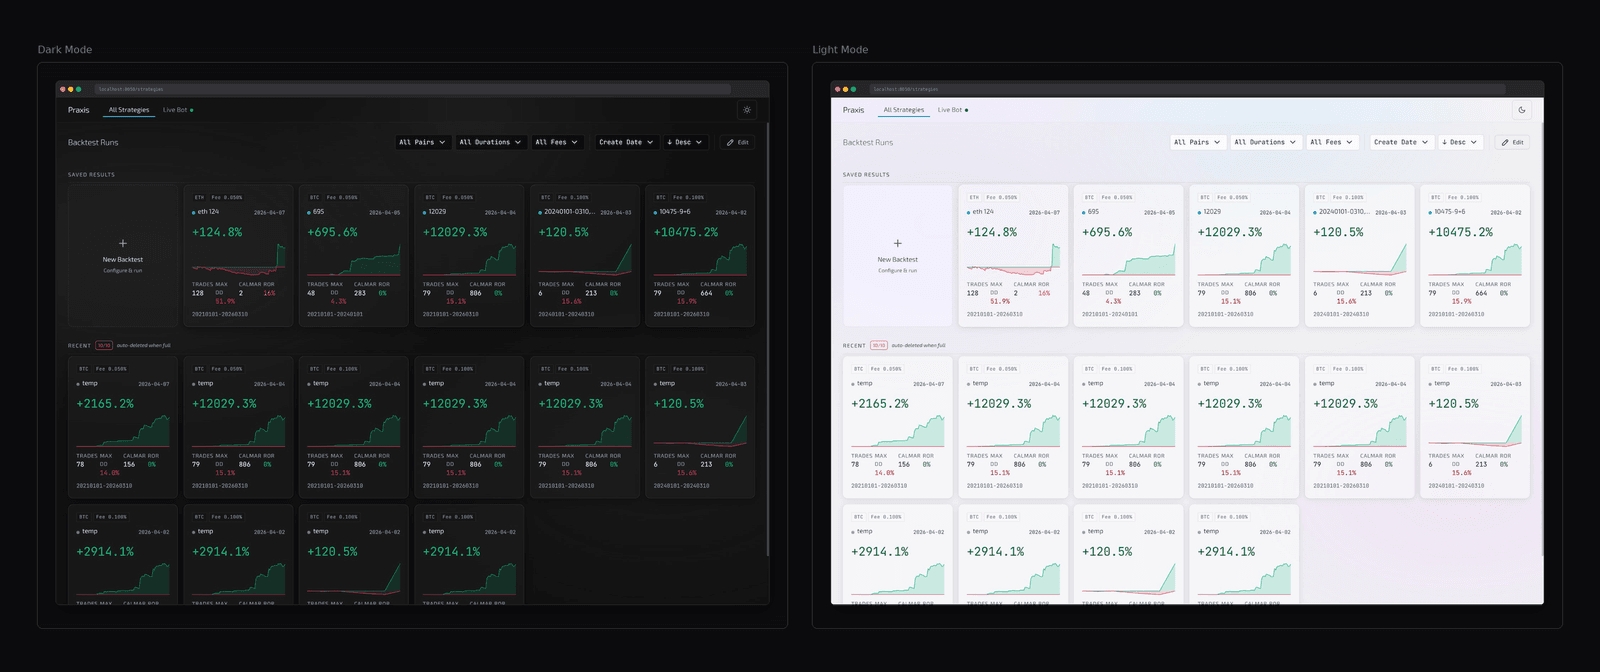
The interface starts from a set of color tokens: a global canvas color, trading-semantic colors, and a version-specific color per strategy. Every level is contrast-checked, so the experience stays consistent when switching between dark and light mode.
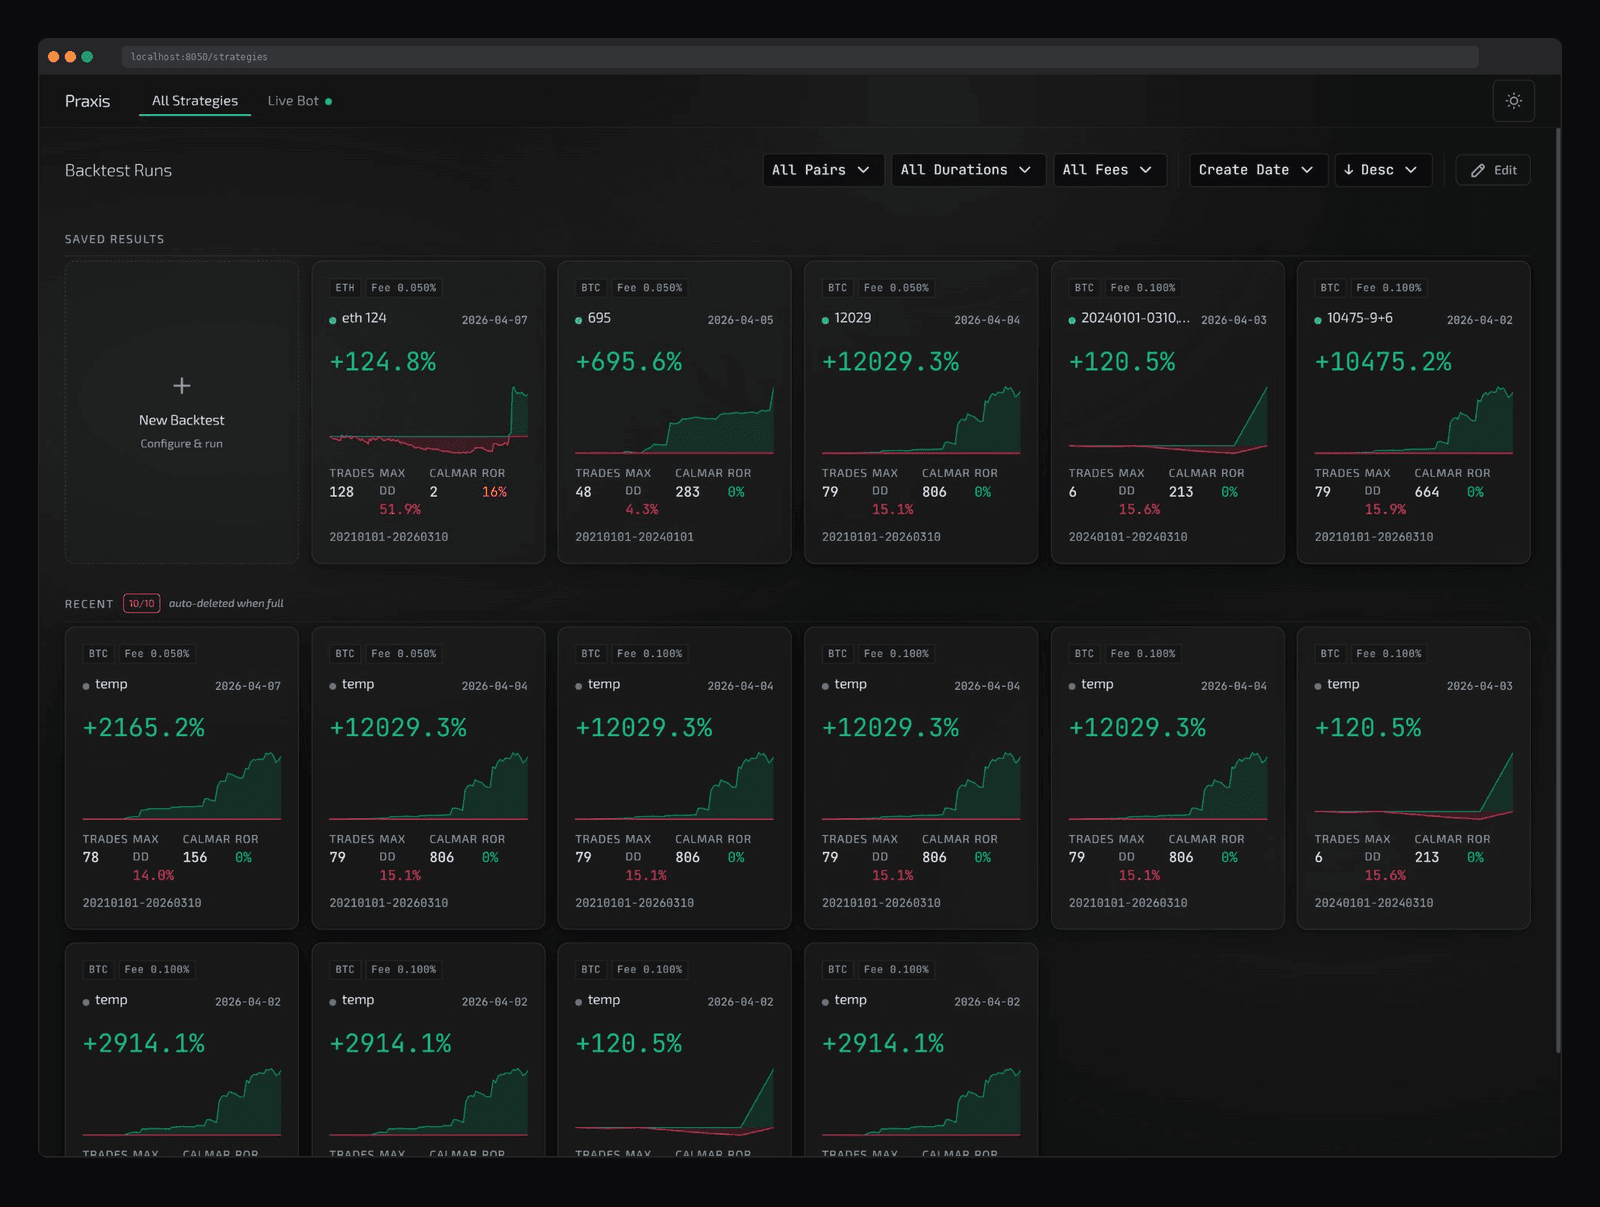
1. A centralized strategy workspace
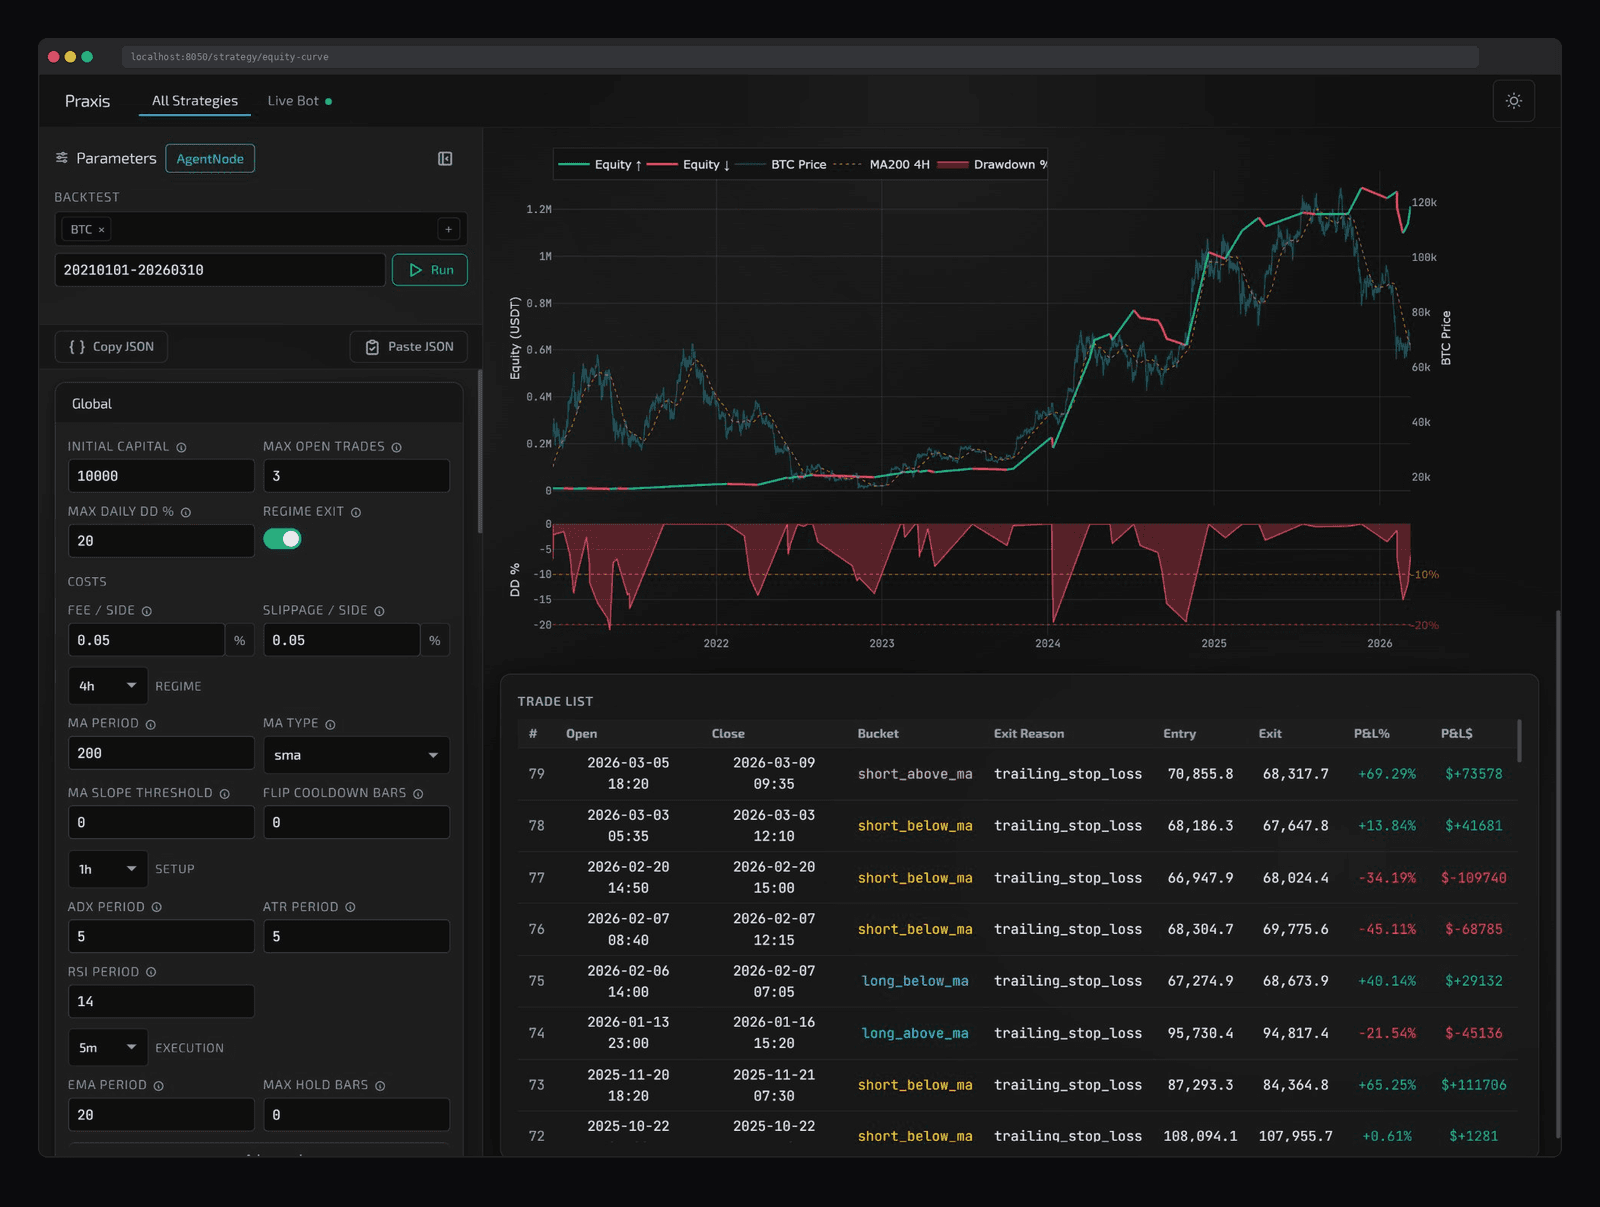
The problem was data scattered across logs, code, and config files. Now it is all organized into “one strategy card + one backtest result view,” so each strategy can be scanned and compared quickly.
2. Three core views
The whole system is reduced to three main screens:
- Comparison View: compare how different strategies perform.
- Dashboard: see the overall strategy state.
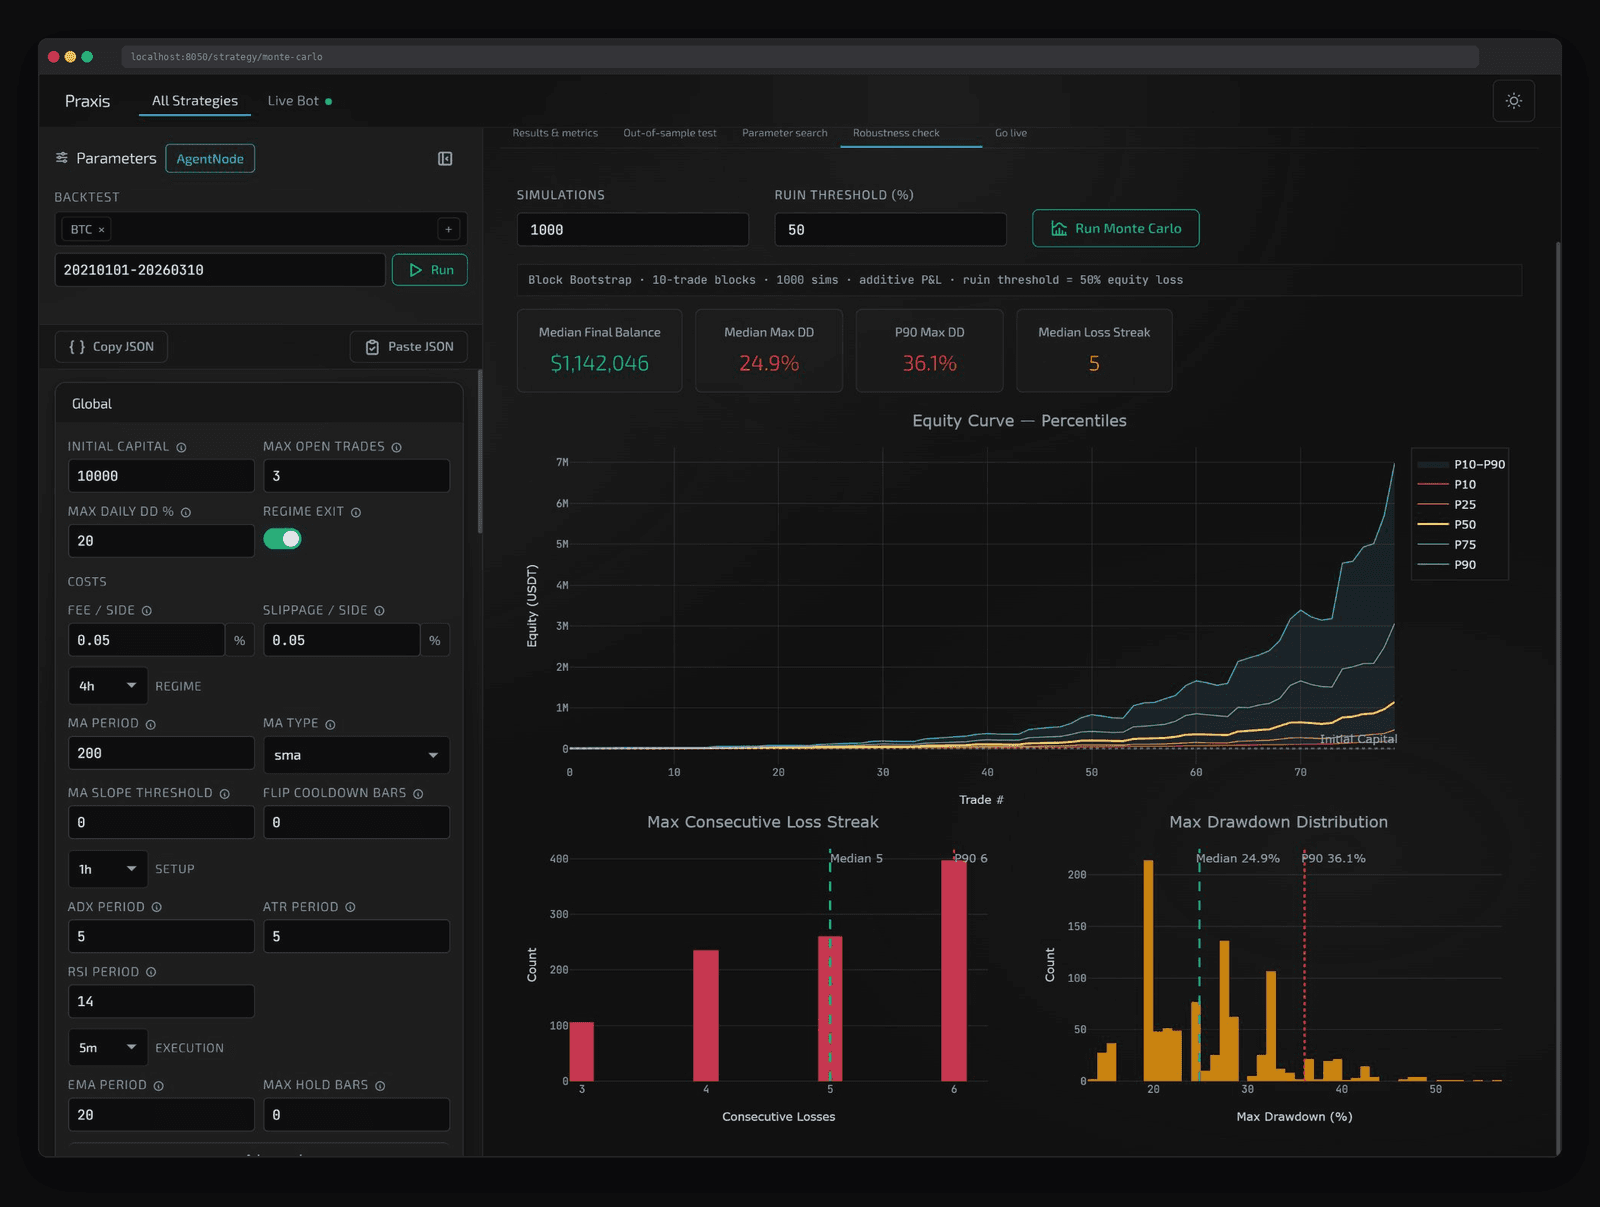
- Robustness: see whether a strategy is stable.
I deliberately did not build a customizable UI. In this context, too much freedom actually slows evaluation down.
3. An interface in the trading context
The interface takes its cues from TradingView and Bloomberg:
- high information density
- a clear numeric hierarchy
- monospace type for the data
The reason is simple: users already know this kind of interface, they do not need to learn it again.
4. Removing FreqAI
FreqAI can run machine-learning predictions, but the problem is that it is a black box. This tool's core goal is to be traceable, understandable, and comparable, so it was removed at the MVP stage.
5. Limiting strategy complexity
Not every strategy is supported. I deliberately kept it within the standard Freqtrade structure. The reason: if the strategies themselves cannot be compared consistently, the evaluation layer loses its meaning.
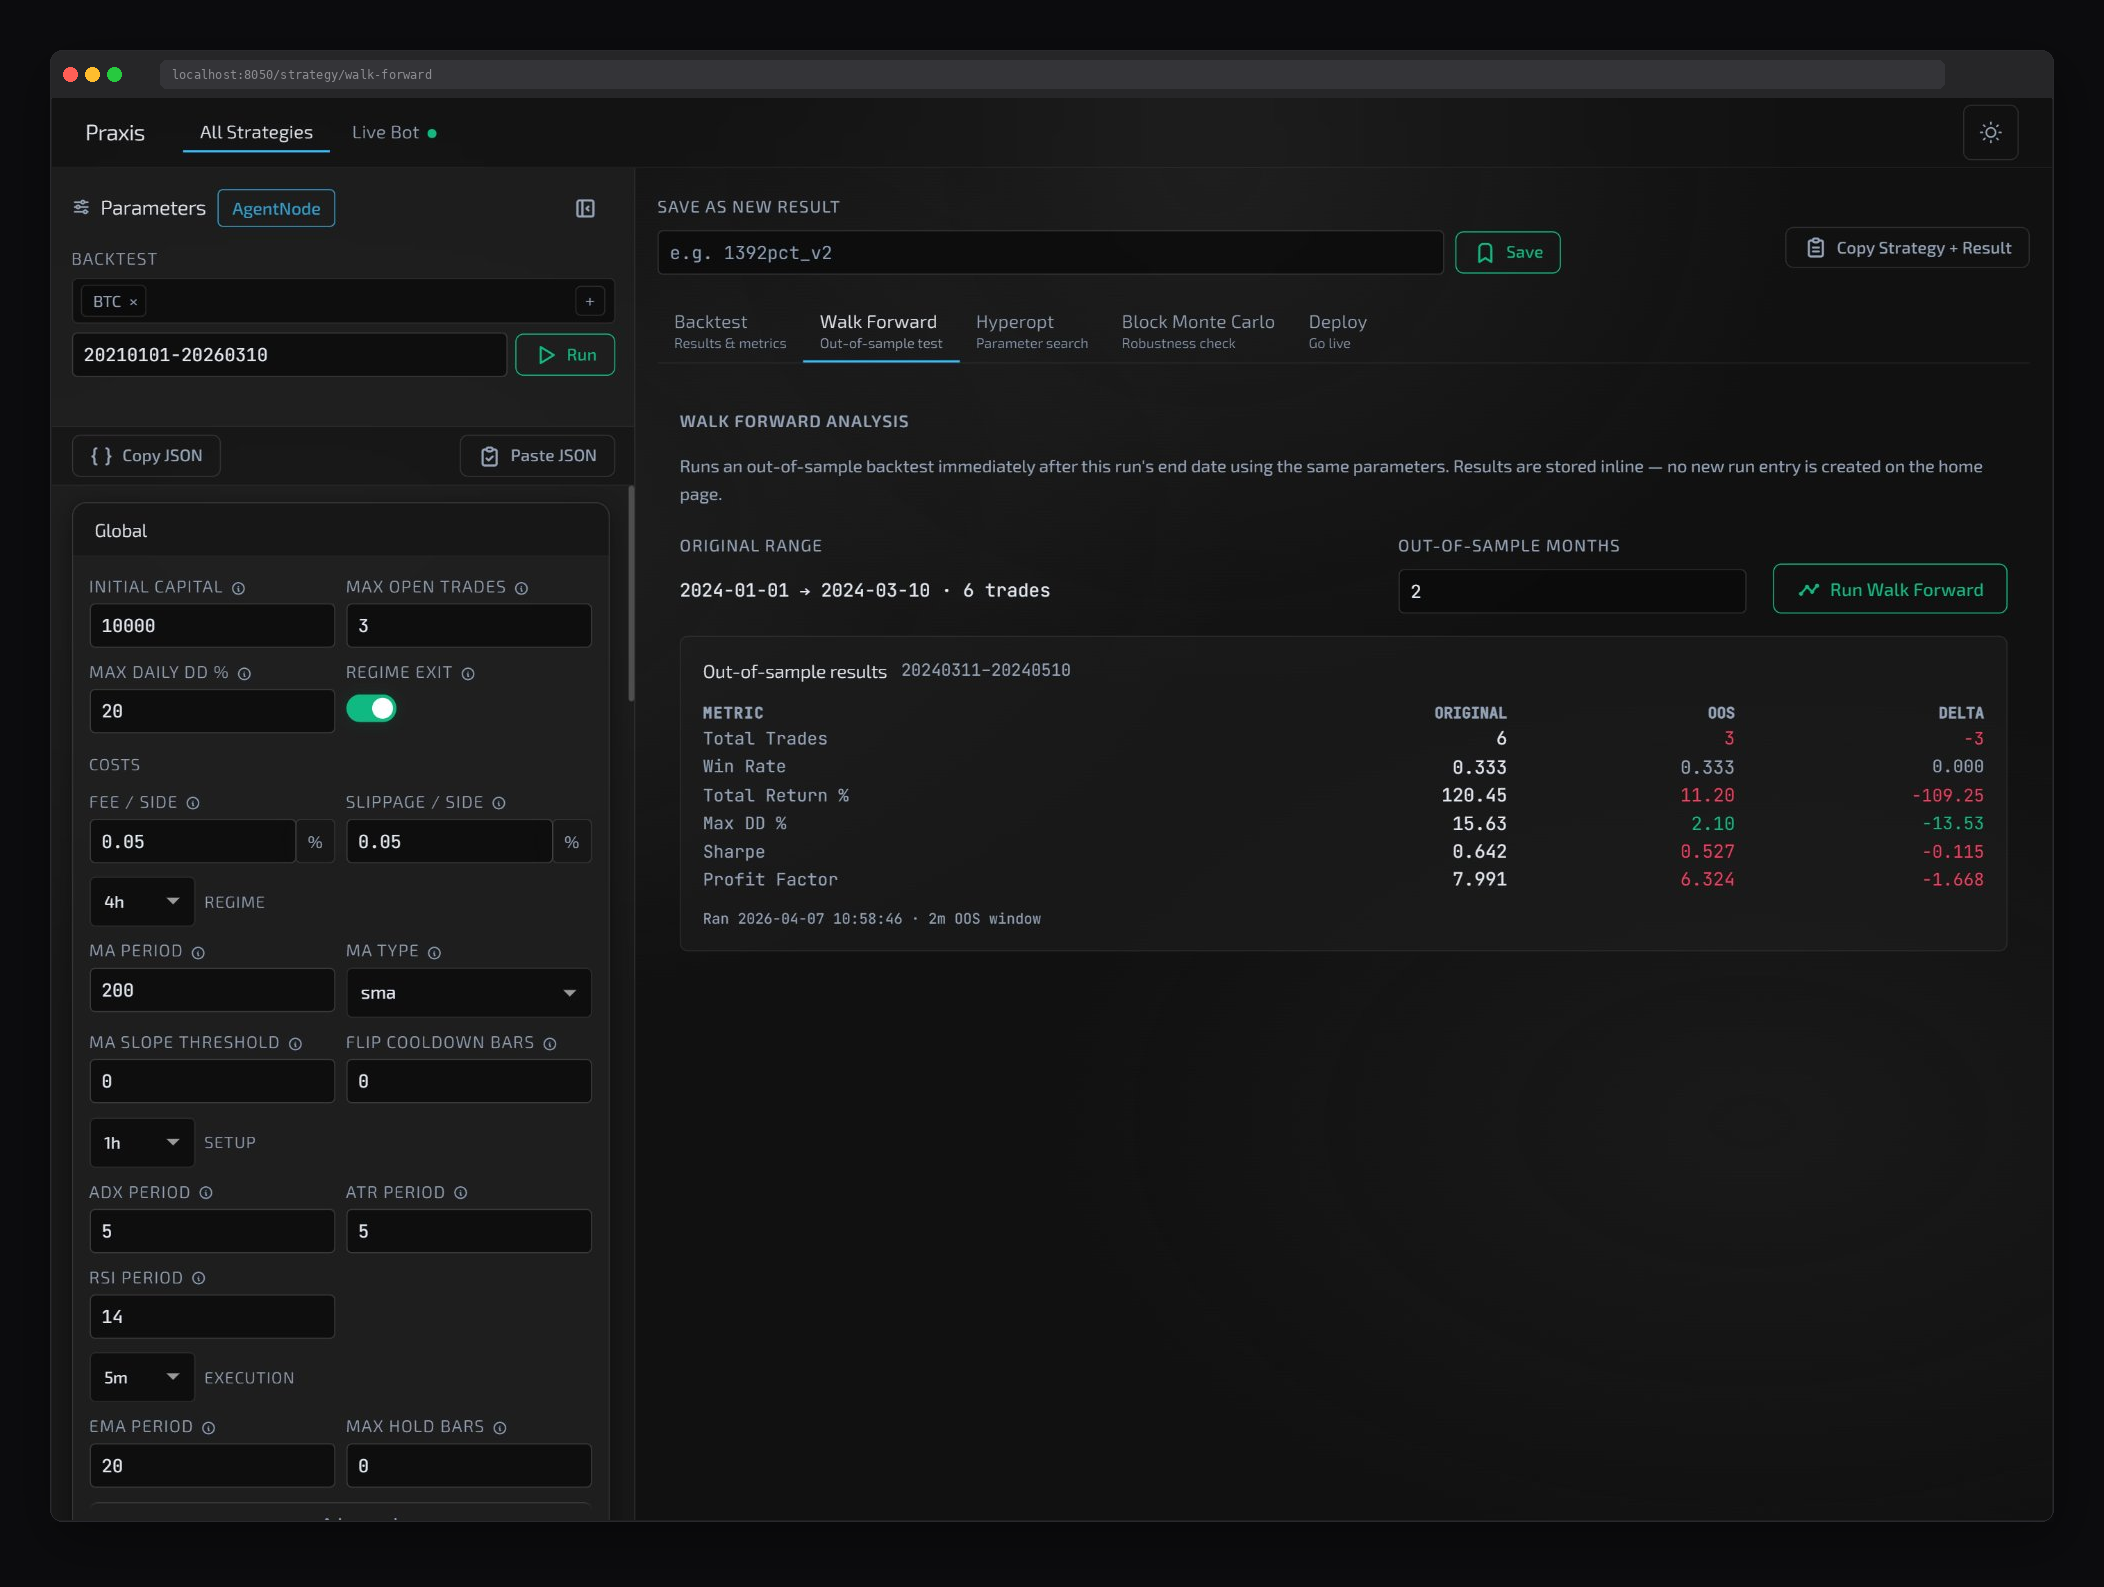
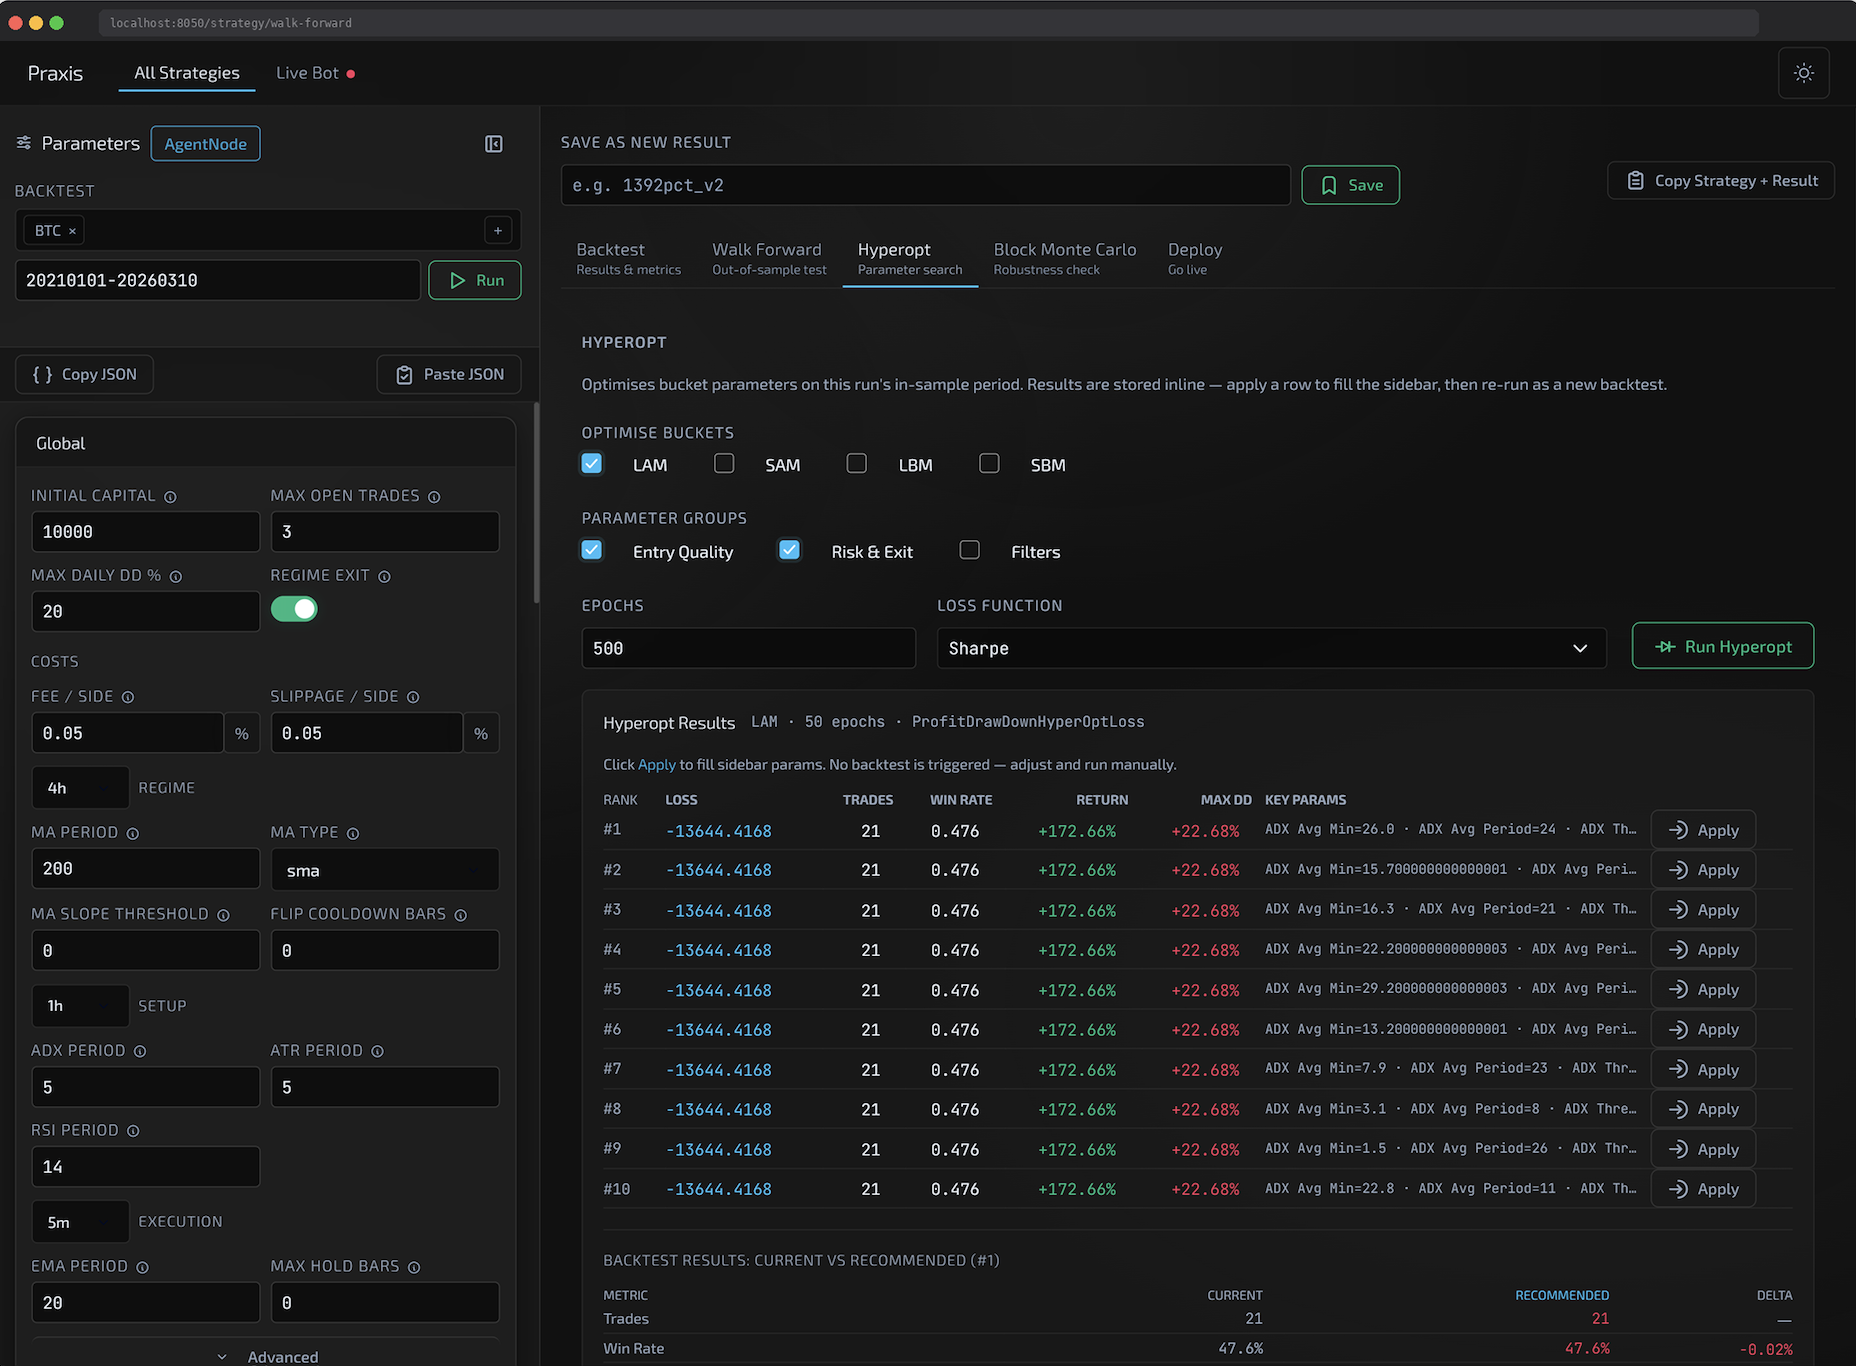
6. Checking whether a strategy actually holds up
A single backtest can look good by luck, so the workspace adds two checks before a strategy earns trust: an out-of-sample run and a parameter search.
DELIVER
Moving time from organizing data to making decisions
Praxis ended up as a local tool that slots straight into the existing workflow. The biggest change: the time that used to go into organizing logs and reconciling data moved to comparing strategies and making the call.
Quantified results
50%
Faster evaluation
Evaluation time for a single strategy dropped from about 3 days to 1.5.
2×
Exploration
Around twice as many strategies can be tested in the same time.
1
Single source of truth
All strategies and backtest results in one dashboard.
REFLECTION
AI changes generation speed, not understanding speed
This project made me more certain of one thing: AI made making things cheap, but understanding things is still expensive. So the real bottleneck will shift, gradually, from production to evaluation.
Directions worth exploring next
Finer trading-behavior analysis
For example tick-by-tick trades, or higher-resolution time-series analysis.
Lower-barrier strategy building
Modularize validated strategy factors into an assemblable system.
A good tool of the future doesn't just help you produce more strategies. It lets you judge, at lower cost, which strategies are not worth continuing.